Supply and DemandThis is a "Supply and Demand" script designed to help traders spot potential levels of supply (resistance) and demand (support) in the market by identifying pivot points from past price action.
Differences from Other Scripts:
Unlike many pivot point scripts, this one offers a greater degree of customization and flexibility, allowing users to determine how many ranges of pivot points they wish to plot (up to 10), as well as the number of the most recent ranges to display.
Furthermore, it allows users to restrict the plotting of pivot points to specific timeframes (15 minutes, 30 minutes, 1 hour, 4 hours, and daily) using a toggle input. This is useful for traders who wish to focus on these popular trading timeframes.
This script also uses the color.new function for a more transparent plotting, which is not commonly used in many scripts.
How to Use:
The script provides two user inputs:
"Number of Ranges to Plot (1-10)": This determines how many 10-bar ranges of pivot points the script will calculate and potentially plot.
"Number of Last Ranges to Show (1-?)": This determines how many of the most recent ranges will be displayed on the chart.
"Limit to specific timeframes?": This is a toggle switch. When turned on, the script only plots pivot points if the current timeframe is one of the following: 15 minutes, 30 minutes, 1 hour, 4 hours, or daily.
The pivot points are plotted as circles on the chart, with pivot highs in red and pivot lows in green. The transparency level of these plots can be adjusted in the script.
Market and Conditions:
This script is versatile and can be used in any market, including Forex, commodities, indices, or cryptocurrencies. It's best used in trending markets where supply and demand levels are more likely to be respected. However, like all technical analysis tools, it's not foolproof and should be used in conjunction with other indicators and analysis techniques to confirm signals and manage risk.
A technical analyst, or technician, uses chart patterns and indicators to predict future price movements. The "Supply and Demand" script in question can be an invaluable tool for a technical analyst for the following reasons:
Identifying Support and Resistance Levels : The pivot points plotted by this script can act as potential levels of support and resistance. When the price of an asset approaches these pivot points, it might bounce back (in case of support) or retreat (in case of resistance). These levels can be used to set stop-loss and take-profit points.
Timeframe Analysis : The ability to limit the plotting of pivot points to specific timeframes is useful for multiple timeframe analysis. For instance, a trader might use a longer timeframe to determine the overall trend and a shorter one to decide the optimal entry and exit points.
Customization : The user inputs provided by the script allow a technician to customize the ranges of pivot points according to their unique trading strategy. They can choose the number of ranges to plot and the number of the most recent ranges to display on the chart.
Confirmation of Other Indicators : If a pivot point coincides with a signal from another indicator (for instance, a moving average crossover or a relative strength index (RSI) divergence), it could provide further confirmation of that signal, increasing the chances of a successful trade.
Transparency in Plots : The use of the color.new function allows for more transparent plotting. This feature can prevent the chart from becoming too cluttered when multiple ranges of pivot points are plotted, making it easier for the analyst to interpret the data.
In summary, this script can be used by a technical analyst to pinpoint potential trading opportunities, validate signals from other indicators, and customize the display of pivot points to suit their individual trading style and strategy. Always remember, however, that no single indicator should be used in isolation, and effective risk management strategies should always be employed.
"pivot points"に関するスクリプトを検索

Chart Patterns [ActiveQuants]The Chart Patterns indicator is a comprehensive tool designed to automatically identify a variety of common chart patterns directly on your price chart. By detecting sequences of pivot highs and lows , this indicator helps traders spot potential trend continuations , reversals , and key market structures such as Double Tops and Double Bottoms . Enhance your technical analysis by quickly recognizing these formations as they emerge.
How It Works
The indicator operates in a two-stage process:
Pivot Point Detection: It first identifies significant swing highs and swing lows (pivot points) based on a user-defined Period . These pivots form the fundamental building blocks for pattern recognition.
Pattern Recognition: Using the sequence of these detected pivot points, the script then applies logical rules to identify the following patterns:
Lower Low (LL)
Lower Low & Lower High (LL & LH)
Higher High (HH)
Higher High & Higher Low (HH & HL)
Double Tops
Double Bottoms
Patterns are drawn on the chart with connecting lines and labeled for easy identification. Double Tops and Double Bottoms also feature a status system: " Active " while forming, " Confirmed " upon neckline breakout, or " Invalid " if specific conditions negate the pattern before confirmation.
█ KEY FEATURES
Comprehensive Pattern Detection: Identifies six distinct types of chart patterns, offering insights into both trend continuation and potential reversals.
Pivot-Based Analysis: Uses a robust method of identifying pivot highs and lows as the foundation for pattern formation.
Pattern Status for Double Tops/Bottoms:
- Active: A Double Top or Double Bottom pattern has formed its two peaks/troughs and the intervening neckline point, but the price has not yet broken beyond the neckline. The pattern is developing .
- Confirmed: The price has decisively closed beyond the neckline (below for Double Top, above for Double Bottom), signaling a potential entry or validation of the pattern.
- Invalid: An " Active " Double Top or Double Bottom pattern can be invalidated if, before a neckline breakout occurs, a new pivot point forms that negates the pattern’s structural integrity. For example, if a new pivot low forms above or at the neckline of an Active Double Top, the pattern is considered invalid because the market failed to break down and instead showed relative strength.
Customizable Visuals: Allows users to define colors for bullish and bearish patterns, line widths, and the visibility of pivot points.
Selective Pattern Display: Users can choose to display all patterns or filter by status (Active, Confirmed, Invalid) for Double Tops/Bottoms. Individual pattern types can also be toggled on or off.
Historical Analysis Control: The Show Last History (Bars) input allows users to specify how far back the indicator should plot patterns, optimizing performance and chart readability.
Clear Labeling: Patterns are clearly labeled on the chart, with Double Tops/Bottoms also showing " Top 1 ," " Top 2 ," or " Bottom 1 ," " Bottom 2 " labels.
█ PATTERNS DETECTED
Lower Low (LL): Indicates a potential bearish continuation or the start of a downtrend. Forms when price makes a lower low during an uptrend.
Lower Low & Lower High (LL & LH): A stronger confirmation of a bearish trend, where the market forms a lower low followed by a lower high .
Higher High (HH): Signals a potential bullish continuation or the start of an uptrend. Forms when price makes a higher high during a downtrend.
Higher High & Higher Low (HH & HL): A stronger confirmation of a bullish trend, where the market forms a higher high followed by a higher low .
Double Top: A bearish reversal pattern characterized by two distinct peaks at roughly the same price level, separated by a trough (neckline). Confirmation occurs when price breaks below the neckline.
Double Bottom: A bullish reversal pattern featuring two distinct troughs at roughly the same price level, separated by a peak (neckline). Confirmation occurs when price breaks above the neckline.
█ EXAMPLE: DOUBLE TOP INVALIDATION
Understanding how a Double Top or Double Bottom can be invalidated is crucial. Here's an example for a Double Top:
Formation: The indicator identifies two peaks (Top 1, Top 2) at a similar price level, with a corrective trough (Neckline Pivot P5) in between. The pattern is labeled " Double Top " and is in an " Active " state. ( Imagine points P4 and P6 are the two tops, and P5 is the low point of the neckline between them ).
Pre-Breakout Condition: The price action continues, but before it breaks decisively below the P5 neckline level, a new significant swing low (a new pivot low) forms.
Invalidation Check: The indicator checks the price level of this new pivot low. If this new pivot low occurs at a price equal to or higher than the P5 neckline level, the " Active " Double Top pattern is re-labeled as " Invalid Double Top ". ( See image below for a visual representation of this scenario )
In this example, the Double Top formed with Top 1 (P4) and Top 2 (P6). The neckline is at P5. Before price broke below P5, a new pivot low formed at the red circle. Since this new pivot low is above the P5 neckline, the Double Top is marked " Invalid ".
The logic is that the market failed to break the neckline support and instead established a higher low (or a low at the support level), suggesting that the immediate bearish pressure has waned, thus invalidating the bearish reversal implication of the Double Top before it could confirm. A similar logic applies to Double Bottoms (a new pivot high forming below or at the neckline before an upside breakout).
█ USER INPUTS
Visibility and Common Styling
- Show Last History (Bars):
Specifies the number of recent bars the indicator will analyze and plot patterns on.
Default: 3000 bars. Min: 10.
- Patterns:
Filters which patterns are displayed based on their status.
Options: All, Active, Confirmed, Invalid.
Default: All.
- Pattern Line Width:
Sets the thickness of the lines used to draw the patterns.
Default: 1. Min: 1, Max: 10.
- Bearish Color:
Color for bearish patterns (LL, LL & LH, Double Tops).
Default: Red.
- Bullish Color:
Color for bullish patterns (HH, HH & HL, Double Bottoms).
Default: Green.
Pivot Points
- Period:
The lookback period on either side of a bar to qualify it as a pivot high or low. Higher values detect more significant pivots.
Default: 10 bars. Min: 2.
- Show Pivot Highs:
Toggles the visibility of detected pivot high markers.
Default: Enabled.
- Show Pivot Lows:
Toggles the visibility of detected pivot low markers.
Default: Enabled.
- Pivot Highs Color:
Color for the pivot high markers.
Default: #ff5252 (Reddish).
- Pivot Lows Color:
Color for the pivot low markers.
Default: #089981 (Greenish).
Patterns (Toggles)
- Lower Low:
Enable/disable detection and display of Lower Low patterns.
Default: Enabled.
- Lower Low & Lower High:
Enable/disable detection and display of Lower Low & Lower High patterns.
Default: Enabled.
- Higher High:
Enable/disable detection and display of Higher High patterns.
Default: Enabled.
- Higher High & Higher Low:
Enable/disable detection and display of Higher High & Higher Low patterns.
Default: Enabled.
- Double Tops:
Enable/disable detection and display of Double Top patterns.
Default: Enabled.
- Double Bottoms:
Enable/disable detection and display of Double Bottom patterns.
Default: Enabled.
█ CONCLUSION
The Chart Patterns indicator is a versatile and powerful assistant for traders who utilize classical chart pattern analysis. By automating the detection of key formations and providing clear visual cues along with status updates for patterns like Double Tops and Bottoms, it allows traders to focus on strategy development and execution. With its customizable settings, it can be adapted to various instruments and timeframes, making it a valuable addition to any technical trader's toolkit.
█ IMPORTANT NOTES
⚠ Pivot Period Sensitivity: The Period setting for pivot detection is crucial. A shorter period will identify more frequent, smaller swings, while a longer period will focus on more significant turning points. Adjust this setting based on the asset's volatility, the timeframe you are trading and your trading style.
⚠ Confirmation is Key: While the indicator identifies patterns, always wait for pattern confirmation (e.g., neckline breaks for Double Tops/Bottoms) and consider other factors like volume and market context before making trading decisions.
⚠ Confirmed Bars for Detection: Patterns are identified based on confirmed pivot points, which means a pivot is recognized period bars after it has formed. Status updates for Double Tops/Bottoms (Active, Confirmed, Invalid) also occur on confirmed bars. This approach enhances reliability and reduces the likelihood of repainting based on intra-bar price fluctuations.
⚠ Not a Standalone System: Chart patterns provide valuable insights, but they should be used in conjunction with other technical analysis tools (e.g., trendlines, moving averages, oscillators) and a sound risk management plan.
⚠ Lagging Nature: By their very definition, chart patterns are lagging indicators as they require a sequence of price action and several pivot points to complete their formation.
█ RISK DISCLAIMER
Trading involves a substantial risk of loss and is not suitable for every investor. The information provided by the Chart Patterns indicator is for educational and informational purposes only. It should not be considered as financial advice or a recommendation to buy or sell any security. Chart patterns indicate potential price movements but do not guarantee future results. Always perform your own due diligence and consult with a qualified financial advisor before making any investment decisions. Past performance is not indicative of future results.
📈 Happy trading! 🚀

Auto TrendLines [TradingFinder] Support Resistance Signal Alerts🔵 Introduction
The trendline is one of the most essential tools in technical analysis, widely used in financial markets such as Forex, cryptocurrency, and stocks. A trendline is a straight line that connects swing highs or swing lows and visually indicates the market’s trend direction.
Traders use trendlines to identify price structure, the strength of buyers and sellers, dynamic support and resistance zones, and optimal entry and exit points.
In technical analysis, trendlines are typically classified into three categories: uptrend lines (drawn by connecting higher lows), downtrend lines (formed by connecting lower highs), and sideways trends (moving horizontally). A valid trendline usually requires at least three confirmed touchpoints to be considered reliable for trading decisions.
Trendlines can serve as the foundation for a variety of trading strategies, such as the trendline bounce strategy, valid breakout setups, and confluence-based analysis with other tools like candlestick patterns, divergences, moving averages, and Fibonacci levels.
Additionally, trendlines are categorized into internal and external, and further into major and minor levels, each serving unique roles in market structure analysis.
🔵 How to Use
Trendlines are a key component in technical analysis, used to identify market direction, define dynamic support and resistance zones, highlight strategic entry and exit points, and manage risk. For a trendline to be reliable, it must be drawn based on structural principles—not by simply connecting two arbitrary points.
🟣 Selecting Pivot Types Based on Trend Direction
The first step is to determine the market trend: uptrend, downtrend, or sideways.
Then, choose pivot points that match the trend type :
In an uptrend, trendlines are drawn by connecting low pivots, especially higher lows.
In a downtrend, trendlines are formed by connecting high pivots, specifically lower highs.
It is crucial to connect pivots of the same type and structure to ensure the trendline is valid and analytically sound.
🟣 Pivot Classification
This indicator automatically classifies pivot points into two categories :
Major Pivots :
MLL : Major Lower Low
MHL : Major Higher Low
MHH : Major Higher High
MLH : Major Lower High
These define the primary structure of the market and are typically used in broader structural analysis.
Minor Pivots :
mLL: minor Lower Low
mHL: minor Higher Low
mHH: minor Higher High
mLH: minor Lower High
These are used for drawing more precise trendlines within corrective waves or internal price movements.
Example : In a downtrend, drawing a trendline from an MHH to an mHH creates structural inconsistency and introduces noise. Instead, connect points like MHL to MHL or mLH to mLH for a valid trendline.
🟣 Drawing High-Precision Trendlines
To ensure a reliable trendline :
Use pivots of the same classification (Major with Major or Minor with Minor).
Ensure at least three valid contact points (three touches = structural confirmation).
Draw through candles with the least deviation (choose wicks or bodies based on confluence).
Preferably draw from right to left for better alignment with current market behavior.
Use parallel lines to turn a single trendline into a trendline zone, if needed.
🟣 Using Trendlines for Trade Entries
Bounce Entry: When price approaches the trendline and shows signs of reversal (e.g., a reversal candle, divergence, or support/resistance), enter in the direction of the trend with a logical stop-loss.
Breakout Entry: When price breaks through the trendline with strong momentum and a confirmation (such as a retest or break of structure), consider trading in the direction of the breakout.
🟣 Trendline-Based Risk Management
For bounce entries, the stop-loss is placed below the trendline or the last pivot low (in an uptrend).
For breakout entries, the stop-loss is set behind the breakout candle or the last structural level.
A broken trendline can also act as an exit signal from a trade.
🟣 Combining Trendlines with Other Tools (Confluence)
Trendlines gain much more strength when used alongside other analytical tools :
Horizontal support and resistance levels
Moving averages (such as EMA 50 or EMA 200)
Fibonacci retracement zones
Candlestick patterns (e.g., Engulfing, Pin Bar)
RSI or MACD divergences
Market structure breaks (BoS / ChoCH)
🔵 Settings
Pivot Period : This defines how sensitive the pivot detection is. A higher number means the algorithm will identify more significant pivot points, resulting in longer-term trendlines.
Alerts
Alert :
Enable or disable the entire alert system
Set a custom alert name
Choose how often alerts trigger (every time, once per bar, or on bar close)
Select the time zone for alert timestamps (e.g., UTC)
Each trendline type supports two alert types :
Break Alert : Triggered when price breaks the trendline
React Alert : Triggered when price reacts or bounces off the trendline
These alerts can be independently enabled or disabled for all trendline categories (Major/Minor, Internal/External, Up/Down).
Display :
For each of the eight trendline types, you can control :
Whether to show or hide the line
Whether to delete the previous line when a new one is drawn
Color, line style (solid, dashed, dotted), extension direction (e.g., right only), and width
Major lines are typically thicker and more opaque, while minor lines appear thinner and more transparent.
All settings are designed to give the user full control over the appearance, behavior, and alert system of the indicator, without requiring manual drawing or adjustments.
🔵 Conclusion
A trendline is more than just a line on the chart—it is a structural, strategic, and flexible tool in technical analysis that can serve as the foundation for understanding price behavior and making trading decisions. Whether in trending markets or during corrections, trendlines help traders identify market direction, key zones, and high-potential entry and exit points with precision.
The accuracy and effectiveness of a trendline depend on using structurally valid pivot points and adhering to proper market logic, rather than relying on guesswork or personal bias.
This indicator is built to solve that exact problem. It automatically detects and draws multiple types of trendlines based on actual price structure, separating them into Major/Minor and Internal/External categories, and respecting professional analytical principles such as pivot type, trend direction, and structural location.

Top-Down Trend and Key Levels with Swing Points//by antaryaami0
Overview
The “Top-Down Trend and Key Levels with Swing Points” indicator is a comprehensive tool designed to enhance your technical analysis by integrating multiple trading concepts into a single, easy-to-use script. It combines higher timeframe trend analysis, key price levels, swing point detection, and ranging market identification to provide a holistic view of market conditions. This indicator is particularly useful for traders who employ multi-timeframe analysis, support and resistance levels, and price action strategies.
Key Features
1. Higher Timeframe Trend Background Shading:
• Purpose: Identifies the prevailing trend on a higher timeframe to align lower timeframe trading decisions with the broader market direction.
• How it Works: The indicator compares the current higher timeframe close with the previous one to determine if the trend is up, down, or ranging.
• Customization:
• Trend Timeframe: Set your preferred higher timeframe (e.g., Daily, Weekly).
• Up Trend Color & Down Trend Color: Customize the background colors for uptrends and downtrends.
• Ranging Market Color: A separate color to indicate when the market is moving sideways.
2. Key Price Levels:
• Previous Day High (PDH) and Low (PDL):
• Purpose: Identifies key support and resistance levels from the previous trading day.
• Visualization: Plots horizontal lines at PDH and PDL with labels.
• Customization: Option to show or hide these levels and customize their colors.
• Pre-Market High (PMH) and Low (PML):
• Purpose: Highlights the price range during the pre-market session, which can indicate potential breakout levels.
• Visualization: Plots horizontal lines at PMH and PML with labels.
• Customization: Option to show or hide these levels and customize their colors.
3. First 5-Minute Marker (F5H/F5L):
• Purpose: Marks the high or low of the first 5 minutes after the market opens, which is significant for intraday momentum.
• How it Works:
• If the first 5-minute high is above the Pre-Market High (PMH), an “F5H” label is placed at the first 5-minute high.
• If the first 5-minute high is below the PMH, an “F5L” label is placed at the first 5-minute low.
• Visualization: Labels are placed at the 9:35 AM candle (closing of the first 5 minutes), colored in purple by default.
• Customization: Option to show or hide the marker and adjust the marker color.
4. Swing Points Detection:
• Purpose: Identifies significant pivot points in price action to help recognize trends and reversals.
• How it Works: Uses left and right bars to detect pivot highs and lows, then determines if they are Higher Highs (HH), Lower Highs (LH), Higher Lows (HL), or Lower Lows (LL).
• Visualization: Plots small markers (circles) with labels (HH, LH, HL, LL) at the corresponding swing points.
• Customization: Adjust the number of left and right bars for pivot detection and the size of the markers.
5. Ranging Market Detection:
• Purpose: Identifies periods when the market is consolidating (moving sideways) within a defined price range.
• How it Works: Calculates the highest high and lowest low over a specified period and determines if the price range is within a set percentage threshold.
• Visualization: Draws a gray box around the price action during the ranging period and labels the high and low prices at the end of the range.
• Customization: Adjust the range detection period and threshold, as well as the box color.
6. Trend Coloring on Chart:
• Purpose: Provides a visual cue for the short-term trend based on a moving average.
• How it Works: Colors the candles green if the price is above the moving average and red if below.
• Customization: Set the moving average length and customize the uptrend and downtrend colors.
How to Use the Indicator
1. Adding the Indicator to Your Chart:
• Copy the Pine Script code provided and paste it into the Pine Script Editor on TradingView.
• Click “Add to Chart” to apply the indicator.
2. Configuring Inputs and Settings:
• Access Inputs:
• Click on the gear icon next to the indicator’s name on your chart to open the settings.
• Customize Key Levels:
• Show Pre-Market High/Low: Toggle on/off.
• Show Previous Day High/Low: Toggle on/off.
• Show First 5-Minute Marker: Toggle on/off.
• Set Trend Parameters:
• Trend Timeframe for Background: Choose the higher timeframe for trend analysis.
• Moving Average Length for Bar Color: Set the period for the moving average used in bar coloring.
• Adjust Ranging Market Detection:
• Range Detection Period: Specify the number of bars to consider for range detection.
• Range Threshold (%): Set the maximum percentage range for the market to be considered ranging.
• Customize Visuals:
• Colors: Adjust colors for trends, levels, markers, and ranging market boxes.
• Label Font Size: Choose the size of labels displayed on the chart.
• Level Line Width: Set the thickness of the lines for key levels.
3. Interpreting the Indicator:
• Background Shading:
• Green Shade: Higher timeframe is in an uptrend.
• Red Shade: Higher timeframe is in a downtrend.
• Gray Box: Market is ranging (sideways movement).
• Key Levels and Markers:
• PDH and PDL Lines: Represent resistance and support from the previous day.
• PMH and PML Lines: Indicate potential breakout levels based on pre-market activity.
• F5H/F5L Labels: Early indication of intraday momentum after market open.
• Swing Point Markers:
• HH (Higher High): Suggests bullish momentum.
• LH (Lower High): May indicate a potential bearish reversal.
• HL (Higher Low): Supports bullish continuation.
• LL (Lower Low): Indicates bearish momentum.
• Ranging Market Box:
• Gray Box Around Price Action: Highlights consolidation periods where breakouts may occur.
• Range High and Low Labels: Provide the upper and lower bounds of the consolidation zone.
4. Applying the Indicator to Your Trading Strategy:
• Trend Alignment:
• Use the higher timeframe trend shading to align your trades with the broader market direction.
• Key Levels Trading:
• Watch for price reactions at PDH, PDL, PMH, and PML for potential entry and exit points.
• Swing Points Analysis:
• Identify trend continuations or reversals by observing the sequence of HH, HL, LH, and LL.
• Ranging Market Strategies:
• During ranging periods, consider range-bound trading strategies or prepare for breakout trades when the price exits the range.
• Intraday Momentum:
• Use the F5H/F5L marker to gauge early market sentiment and potential intraday trends.
Practical Tips
• Adjust Settings to Your Trading Style:
• Tailor the indicator’s inputs to match your preferred timeframes and trading instruments.
• Combine with Other Indicators:
• Use in conjunction with volume indicators, oscillators, or other technical tools for additional confirmation.
• Backtesting:
• Apply the indicator to historical data to observe how it performs and refine your settings accordingly.
• Stay Updated on Market Conditions:
• Be aware of news events or economic releases that may impact market behavior and the effectiveness of technical levels.
Customization Options
• Time Zone Adjustment:
• The script uses “America/New_York” time zone by default. Adjust the timezone variable in the script if your chart operates in a different time zone.
var timezone = "Your/Timezone"
• Session Times:
• Modify the Regular Trading Session and Pre-Market Session times in the indicator settings to align with the trading hours of different markets or exchanges.
• Visual Preferences:
• Colors: Personalize the indicator’s colors to suit your visual preferences or to enhance visibility.
• Label Sizes: Adjust label sizes if you find them too intrusive or not prominent enough.
• Marker Sizes: Further reduce or enlarge the swing point markers by modifying the swing_marker_size variable.
Understanding the Indicator’s Logic
1. Higher Timeframe Trend Analysis:
• The indicator retrieves the closing prices of a higher timeframe using the request.security() function.
• It compares the current higher timeframe close with the previous one to determine the trend direction.
2. Key Level Calculation:
• Previous Day High/Low: Calculated by tracking the highest and lowest prices of the previous trading day.
• Pre-Market High/Low: Calculated by monitoring price action during the pre-market session.
3. First 5-Minute Marker Logic:
• At 9:35 AM (end of the first 5 minutes after market open), the indicator evaluates whether the first 5-minute high is above or below the PMH.
• It then places the appropriate label (F5H or F5L) on the chart.
4. Swing Points Detection:
• The script uses ta.pivothigh() and ta.pivotlow() functions to detect pivot points.
• It then determines the type of swing point based on comparisons with previous swings.
5. Ranging Market Detection:
• The indicator looks back over a specified number of bars to find the highest high and lowest low.
• It calculates the percentage difference between these two points.
• If the difference is below the set threshold, the market is considered to be ranging, and a box is drawn around the price action.
Limitations and Considerations
• Indicator Limitations:
• Maximum Boxes and Labels: Due to Pine Script limitations, there is a maximum number of boxes and labels that can be displayed simultaneously.
• Performance Impact: Adding multiple visual elements (boxes, labels, markers) can affect the performance of the script on lower-end devices or with large amounts of data.
• Market Conditions:
• False Signals: Like any technical tool, the indicator may produce false signals, especially during volatile or erratic market conditions.
• Not a Standalone Solution: This indicator should be used as part of a comprehensive trading strategy, including risk management and other forms of analysis.
Conclusion
The “Top-Down Trend and Key Levels with Swing Points” indicator is a versatile tool that integrates essential aspects of technical analysis into one script. By providing insights into higher timeframe trends, highlighting key price levels, detecting swing points, and identifying ranging markets, it equips traders with valuable information to make more informed trading decisions. Whether you are a day trader looking for intraday opportunities or a swing trader aiming to align with the broader trend, this indicator can enhance your chart analysis and trading strategy.
Disclaimer
Trading involves significant risk, and it’s important to understand that past performance is not indicative of future results. This indicator is a tool to assist in analysis and should not be solely relied upon for making trading decisions. Always conduct thorough research and consider seeking advice from financial professionals before engaging in trading activities.

FibExtender [tradeviZion]FibExtender : A Guide to Identifying Resistance with Fibonacci Levels
Introduction
Fibonacci levels are essential tools in technical analysis, helping traders identify potential resistance and support zones in trending markets. FibExtender is designed to make this analysis accessible to traders at all levels, especially beginners, by automating the process of plotting Fibonacci extensions. With FibExtender, you can visualize potential resistance levels quickly, empowering you to make more informed trading decisions without manually identifying every pivot point. In this article, we’ll explore how FibExtender works, guide you step-by-step in using it, and share insights for both beginner and advanced users.
What is FibExtender ?
FibExtender is an advanced tool that automates Fibonacci extension plotting based on significant pivot points in price movements. Fibonacci extensions are percentages based on prior price swings, often used to forecast potential resistance zones where price might reverse or consolidate. By automatically marking these Fibonacci levels on your chart, FibExtender saves time and reduces the complexity of technical analysis, especially for users unfamiliar with calculating and plotting these levels manually.
FibExtender not only identifies Fibonacci levels but also provides a customizable framework where you can adjust anchor points, colors, and level visibility to suit your trading strategy. This customization allows traders to tailor the indicator to fit different market conditions and personal preferences.
Key Features of FibExtender
FibExtender offers several features to make Fibonacci level analysis easier and more effective. Here are some highlights:
Automated Fibonacci Level Identification : The script automatically detects recent swing lows and pivot points to anchor Fibonacci extensions, allowing you to view potential resistance levels with minimal effort.
Customizable Fibonacci Levels : Users can adjust the specific Fibonacci levels they want to display (e.g., 0.618, 1.0, 1.618), enabling a more focused analysis based on preferred ratios. Each level can be color-coded for visual clarity.
Dual Anchor Points : FibExtender allows you to choose between anchoring levels from either the last pivot low or a recent swing low, depending on your preference. This flexibility helps in aligning Fibonacci levels with key market structures.
Transparency and Visual Hierarchy : FibExtender automatically adjusts the transparency of levels based on their "sequence age," creating a subtle visual hierarchy. Older levels appear slightly faded, helping you focus on more recent, potentially impactful levels.
Connection Lines for Context : FibExtender draws connecting lines from recent lows to pivot highs, allowing users to visualize the price movements that generated each Fibonacci extension level.
Step-by-Step Guide for Beginners
Let’s walk through how to use the FibExtender script on a TradingView chart. This guide will ensure that you’re able to set it up and interpret the key information displayed by the indicator.
Step 1: Adding FibExtender to Your Chart
Open your TradingView chart and select the asset you wish to analyze.
Search for “FibExtender ” in the Indicators section.
Click to add the indicator to your chart, and it will automatically plot Fibonacci levels based on recent pivot points.
Step 2: Customizing Fibonacci Levels
Adjust Levels : Under the "Fibonacci Settings" tab, you can enable or disable specific levels, such as 0.618, 1.0, or 1.618. You can also change the color for each level to improve visibility.
Set Anchor Points : Choose between "Last Pivot Low" and "Recent Swing Low" as your Fibonacci anchor point. If you want a broader view, choose "Recent Swing Low"; if you prefer tighter levels, "Last Pivot Low" may be more suitable.
Fib Line Length : Modify the line length for Fibonacci levels to make them more visible on your chart.
Step 3: Spotting Visual Clusters (Manual Analysis)
Identify Potential Resistance Clusters : Look for areas on your chart where multiple Fibonacci levels appear close together. For example, if you see 1.0, 1.272, and 1.618 levels clustered within a small price range, this may indicate a stronger resistance zone.
Why Clusters Matter : Visual clusters often signify areas where traders expect heightened price reaction. When levels are close, it suggests that resistance may be reinforced by multiple significant ratios, making it harder for price to break through. Use these clusters to anticipate potential pullbacks or consolidation areas.
Step 4: Observing the Price Action Around Fibonacci Levels
As price approaches these identified levels, watch for any slowing momentum or reversal patterns, such as doji candles or bearish engulfing formations, that might confirm resistance.
Adjust Strategy Based on Resistance : If price hesitates or reverses at a clustered resistance zone, it may be a signal to secure profits or tighten stops on a long position.
Advanced Insights (for Intermediate to Advanced Users)
For users interested in the technical workings of FibExtender, this section provides insights into how the indicator functions on a code level.
Pivot Point and Swing Detection
FibExtender uses a pivot-high and pivot-low detection function to identify significant price points. The upFractal and dnFractal variables detect these levels based on recent highs and lows, creating the basis for Fibonacci extension calculations. Here’s an example of the code used for this detection:
// Fractal Calculations
upFractal = ta.pivothigh(n, n)
dnFractal = ta.pivotlow(n, n)
By setting the number of periods for n, users can adjust the sensitivity of the script to recent price swings.
Fibonacci Level Calculation
The following function calculates the Fibonacci levels based on the selected pivot points and applies each level’s specific ratio (e.g., 0.618, 1.618) to project extensions above the recent price swing.
calculateFibExtensions(float startPrice, float highPrice, float retracePrice) =>
fibRange = highPrice - startPrice
var float levels = array.new_float(0)
array.clear(levels)
if array.size(fibLevels) > 0
for i = 0 to array.size(fibLevels) - 1
level = retracePrice + (fibRange * array.get(fibLevels, i))
array.push(levels, level)
levels
This function iterates over each level enabled by the user, calculating extensions by multiplying the price range by the corresponding Fibonacci ratio.
Example Use Case: Identifying Resistance in Microsoft (MSFT)
To better understand how FibExtender highlights resistance, let’s look at Microsoft’s stock chart (MSFT), as shown in the image. The chart displays several Fibonacci levels extending upward from a recent pivot low around $408.17. Here’s how you can interpret the chart:
Clustered Resistance Levels : In the chart, note the grouping of several Fibonacci levels in the range of $450–$470. These levels, particularly when tightly packed, suggest a zone where Microsoft may encounter stronger resistance, as multiple Fibonacci levels signal potential barriers.
Applying Trading Strategies : As price approaches this clustered resistance, traders can watch for weakening momentum. If price begins to stall, it may be wise to lock in profits on long positions or set tighter stop-loss orders.
Observing Momentum Reversals : Look for specific candlestick patterns as price nears these levels, such as bearish engulfing candles or doji patterns. Such patterns can confirm resistance, helping you make informed decisions on whether to exit or manage your position.
Conclusion: Harnessing Fibonacci Extensions with FibExtender
FibExtender is a powerful tool for identifying potential resistance levels without the need for manual Fibonacci calculations. It automates the detection of key swing points and projects Fibonacci extensions, offering traders a straightforward approach to spotting potential resistance zones. For beginners, FibExtender provides a user-friendly gateway to technical analysis, helping you visualize levels where price may react.
For those with a bit more experience, the indicator offers insight into pivot points and Fibonacci calculations, enabling you to fine-tune the analysis for different market conditions. By carefully observing price reactions around clustered levels, users can identify areas of stronger resistance and refine their trade management strategies accordingly.
FibExtender is not just a tool but a framework for disciplined analysis. Using Fibonacci levels for guidance can support your trading decisions, helping you recognize areas where price might struggle or reverse. Integrating FibExtender into your trading strategy can simplify the complexity of Fibonacci extensions and enhance your understanding of resistance dynamics.
Note: Always practice proper risk management and thoroughly test the indicator to ensure it aligns with your trading strategy. Past performance is not indicative of future results.
Trade smarter with TradeVizion—unlock your trading potential today!

Pivot Point Profile [LuxAlgo]The Pivot Point Profile indicator groups and displays data accumulated from previous pivot points, providing a comprehensive method for prioritizing and displaying areas of interest directly given by swing highs and lows.
Users have access to common settings present in other profile-type indicators.
🔶 USAGE
The Pivot Point Profile is particularly helpful in identifying highly active reversal zones that have been visited multiple times by price. Because of this, we could generally expect these areas to serve as future points of interest, often acting as support or resistance when re-visited.
The profile displays data associated with both Pivot Highs and Pivot Lows. Each row consists of pivot high and pivot low counts side-by-side, forming the total width of the row.
By analyzing the row as a whole, we can gain a better understanding of WHERE to look for interactions.
By analyzing the pivot counts independently, we can gain a better understanding of WHAT to expect when returning to these areas.
For example:
If a row in the profile contains entirely Pivot Lows, this could be seen as an indication to look for buyers to hold that level for a continuation upwards. A break of this level could be interpreted as a lack of interest from previous buyers at this level, indicating a further move down.
🔹 Concentrated Areas
Each row in the profile displays the current count of high pivots and low pivots within the selected lookback. The largest count for each pivot direction is identified as a "Concentrated Area (CA)", these CAs are highlighted over the chart with a line displaying the average of all pivots within that CA. The CA Average is the average of all pivot points (in the majority direction) within the given row.
These can hold more importance as potential support/resistance areas.
Note: The CA Threshold can be manually adjusted to highlight all rows based on a user-selected value.
🔶 DETAILS
🔹 Calculation
The idea behind the Pivot Point Profile is a new analysis method for pivot points, taking the idea of a volume profile and adapting it to display pivot points instead of volume. By using this data, in theory, we should be able to better prioritize zones to anticipate reversals, as well as identify key levels to watch for buyer & seller interactions to use as confirmations in direction.
The (vertical) width of each row is the product of the script's "Row Size", this is the number of rows that the profile will consist of. With a max of 250, the profile can be decently granular. That being said, A more granular profile will have fewer overlapping pivot points. By decreasing the row size (Using fewer rows in the profile) you will increase the tolerance for grouping pivot points. Potentially leading to a more comprehensive Profile. Inversely, By reducing the tolerance for grouping, you will better visualize only similar highs and lows but may have noisier data to sift through.
The Profile is calculated based on a "Lookback" parameter, using only the lookback amount of previous high and low pivots to calculate the profile. Configuring this parameter alongside "Pivot Length", will allow for great control over the frame of reference of the profile.
Note: This indicator is capable of utilizing the full chart history of pivot points, this can be done by enabling the "Use Full Chart History" setting, this will cause the script will calculate from everything it has access to on your current chart.
🔹 Display
The Pivot Point Profile display can be customized to fit a various range of chart styles and visual needs. The specific settings to adjust these can be located in the "Profile Display" Section of the User Inputs.
Profile Width: Sets the Left to Right Width of the Profile. This is the maximum width that the profile will occupy and will scale to fit within this width.
Profile Offset: Sets the distance of the Profile's Axis from the current chart candle. This moves the entire profile left and right to enable to user to set the distance between the profile and the current candle.
Direction: Changes the display direction of the profile, allowing for "Left", "Right", or "Center" display styles.
🔶 SETTINGS
🔹 Pivot Point Parameters
Pivot Type: Choose between "Fractal Pivots" or "SMC Structure" to use as the basis for pivots.
Length: Sets the length for the pivot calculations.
🔹 Profile Calculations Parameters
Lookback: Sets the number of pivots to calculate within, in increments of high and low pairs. (Setting this to 1 = 1 Pivot High & 1 Pivot Low)
Use Full Chart History: Disregards the set lookback and instead uses all available chart data to calculate from.
Row Size: Sets the total number of rows to calculate the profile with.
🔹 Profile Display
Profile Width: Sets the max left & right width (in bars) that the profile will occupy.
Profile Offset: Sets the distance of the profile axis from the last chart bar.
Direction: Sets the display direction
🔹 Concentrated Areas
Highlight CAs: Extends the rows left from concentrated areas.
CA Threshold: Manually set the threshold for determining concentrated areas, when disabled, only the largest rows will be displayed.
CA Averages: Toggles the concentrated area averages for each pivot direction.
Note: CA Averages can be displayed independently without CA Highlights being displayed, and vice versa.

Automatic TrendlinesIntroduction
For a full free tutorial explaining this code in more detail, visit the backtest-rookies (.com) website.
This indicator will plot two trend lines at any given time. A resistance trend line and a support trend line. The resistance trend is shown with red circles and is created by joining swing highs together. The second is a support trend which is created by joining swing lows.
Since we need swings to make the trend, the trend line code contains code for the swing detection. You can play around with the swing detection to alter how frequently new trend lines are detected. Relying on swings also means that there will be some delay in trend detection depending on how you configure the swing detection. The higher you set rightbars, the more lag you will have before a trend is detected. However, at the same time the quality of the pivots found will increase. So it is a trade-off you need to come to terms with and decide what the best settings are for you.
Lines
A single trend line is made up of several components.
Pivot Points: Marked as blue or orange circles. There will be two pivots per trend.
Orange/Purple Lines: Connecting all pivot points. You will see these lines change direction slightly each time a new pivot is detected (new circles appear).
Green/Red Circle lines: Showing the trend line from the earliest moment a new trend is detected.
Blue Dashed lines: Joining the purple and green/red circle lines so the full trend line can be seen.
Note: The blue dashed lines use pine-scripts drawing functions. As such, there is a limit to how many of these can be placed on a chart. When the limit is reached, the oldest line will be removed so the newest can be drawn. This means that if you detect enough trends and scroll back in time, the blue dashed lines will disappear at some point!

Trend Line Methods (TLM)Trend Line Methods (TLM)
Overview
Trend Line Methods (TLM) is a visual study designed to help traders explore trend structure using two complementary, auto-drawn trend channels. The script focuses on how price interacts with rising or falling boundaries over time. It does not generate trade signals or manage risk; its purpose is to support discretionary chart analysis.
Method 1 – Pivot Span Trendline
The Pivot Span Trendline method builds a dynamic channel from major swing points detected by pivot highs and pivot lows.
• The script tracks a configurable number of recent pivot highs and lows.
• From the oldest and most recent stored pivot highs, it draws an upper trend line.
• From the oldest and most recent stored pivot lows, it draws a lower trend line.
• An optional filled area can be drawn between the two lines to highlight the active trend span.
As new pivots form, the lines are recalculated so that the channel evolves with market structure. This method is useful for visualising how price respects a trend corridor defined directly by swing points.
Method 2 – 5-Point Straight Channel
The 5-Point Straight Channel method approximates a straight trend channel using five key points extracted from a fixed lookback window.
Within the selected window:
• The window is divided into five segments of similar length.
• In each segment, the highest high is used as a representative high point.
• In each segment, the lowest low is used as a representative low point.
• A straight regression-style line is fitted through the five high points to form the upper boundary.
• A second straight line is fitted through the five low points to form the lower boundary.
The result is a pair of straight lines that describe the overall directional channel of price over the chosen window. Compared to Method 1, this approach is less focused on the very latest swings and more on the broader slope of the market.
Inputs & Menus
Pivot Span Trendline group (Method 1)
• Enable Pivot Span Trendline – Turns Method 1 on or off.
• High trend line color / Low trend line color – Colors of the upper and lower trend lines.
• Fill color between trend lines – Base color used to shade the area between the two lines. Transparency is controlled internally.
• Trend line thickness – Line width for both high and low trend lines.
• Trend line style – Line style (solid, dashed, or dotted).
• Pivot Left / Pivot Right – Number of bars to the left and right used to confirm pivot highs and lows. Larger values produce fewer but more significant swing points.
• Pivot Count – How many historical pivot points are kept for constructing the trend lines.
• Lookback Length – Number of bars used to keep pivots in range and to extend the trend lines across the chart.
5-Point Straight Channel group (Method 2)
• Enable 5-Point Straight Channel – Turns Method 2 on or off.
• High channel line color / Low channel line color – Colors of the upper and lower channel lines.
• Channel line thickness – Line width for both channel lines.
• Channel line style – Line style (solid, dashed, or dotted).
• Channel Length (bars) – Lookback window used to divide price into five segments and build the straight high/low channel.
Using Both Methods Together
Both methods are designed to visualise the same underlying idea: price tends to move inside rising or falling channels. Method 1 emphasises the most recent swing structure via pivot points, while Method 2 summarises the broader channel over a fixed window.
When the Pivot Span Trendline corridor and the 5-Point Straight Channel boundaries align or intersect, they can highlight zones where multiple ways of drawing trend lines point to similar support or resistance areas. Traders can use these confluence zones as a visual reference when planning their own entries, exits, or risk levels, according to their personal trading plan.
Notes
• This script is meant as an educational and analytical tool for studying trend lines and channels.
• It does not generate trading signals and does not replace independent analysis or risk management.
• The behaviour of both methods is timeframe- and symbol-agnostic; they will adapt to whichever chart you apply them to.

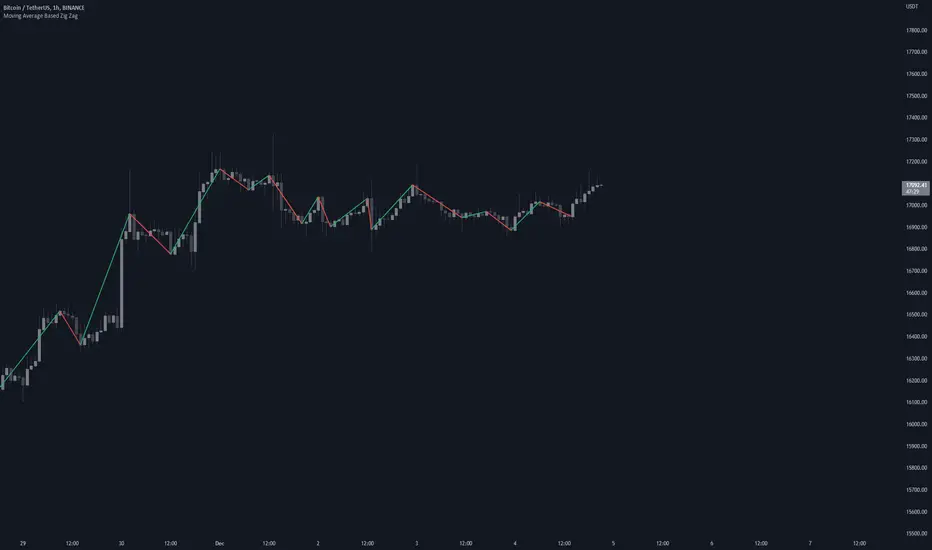
Percentage Based ZigZag█ OVERVIEW
The Percentage-Based ZigZag indicator is a custom technical analysis tool designed to highlight significant price reversals while filtering out market noise. Unlike many standard zigzag tools that rely solely on fixed price moves or generic trend-following methods, this indicator uses a configurable percentage threshold to dynamically determine meaningful pivot points. This approach not only adapts to different market conditions but also helps traders distinguish between minor fluctuations and truly significant trend shifts—whether scalping on shorter timeframes or analyzing longer-term trends.
█ KEY FEATURES & ORIGINALITY
Dynamic Pivot Detection
The indicator identifies pivot points by measuring the percentage change from the previous extreme (high or low). Only when this change exceeds a user-defined threshold is a new pivot recognized. This method ensures that only substantial moves are considered, making the indicator robust in volatile or noisy markets.
Enhanced ZigZag Visualization
By connecting significant highs and lows with a continuous line, the indicator creates a clear visual map of price swings. Each pivot point is labelled with the corresponding price and the percentage change from the previous pivot, providing immediate quantitative insight into the magnitude of the move.
Trend Reversal Projections
In addition to marking completed reversals, the script computes and displays potential future reversal points based on the current trend’s momentum. This forecasting element gives traders an advanced look at possible turning points, which can be particularly useful for short-term scalping strategies.
Customizable Visual Settings
Users can tailor the appearance by:
• Setting the percentage threshold to control sensitivity.
• Customizing colors for bullish (e.g., green) and bearish (e.g., red) reversals.
• Enabling optional background color changes that visually indicate the prevailing trend.
█ UNDERLYING METHODOLOGY & CALCULATIONS
Percentage-Based Filtering
The script continuously monitors price action and calculates the relative percentage change from the last identified pivot. A new pivot is confirmed only when the price moves a preset percentage away from this pivot, ensuring that minor fluctuations do not trigger false signals.
Pivot Point Logic
The indicator tracks the highest high and the lowest low since the last pivot. When the price reverses by the required percentage from these extremes, the algorithm:
1 — Labels the point as a significant high or low.
2 — Draws a connecting line from the previous pivot to the current one.
3 — Resets the extreme-tracking for detecting the next move.
Real-Time Reversal Estimation
Building on traditional zigzag methods, the script incorporates a projection calculation. By analyzing the current trend’s strength and recent percentage moves, it estimates where a future reversal might occur, offering traders actionable foresight.
█ HOW TO USE THE INDICATOR
1 — Apply the Indicator
• Add the Percentage-Based ZigZag indicator to your trading chart.
2 — Adjust Settings for Your Market
• Percentage Move – Set a threshold that matches your trading style:
- Lower values for sensitive, high-frequency analysis (ideal for scalping).
- Higher values for filtering out noise on longer timeframes.
• Visual Customization – Choose your preferred colors for bullish and bearish signals and enable background color changes for visual trend cues.
• Reversal Projection – Enable or disable the projection feature to display potential upcoming reversal points.
3 — Interpret the Signals
• ZigZag Lines – White lines trace significant high-to-low or low-to-high movements, visually connecting key swing points.
• Pivot Labels – Each pivot is annotated with the exact price level and percentage change, providing quantitative insight into market momentum.
• Trend Projections – When enabled, projected reversal levels offer insight into where the current trend might change.
4 — Integrate with Your Trading Strategy
• Use the indicator to identify support and resistance zones derived from significant pivots.
• Combine the quantitative data (percentage changes) with your risk management strategy to set optimal stop-loss and take-profit levels.
• Experiment with different threshold settings to adapt the indicator for various instruments or market conditions.
█ CONCLUSION
The Percentage-Based ZigZag indicator goes beyond traditional trend-following tools by filtering out market noise and providing clear, quantifiable insights into price action. With its percentage threshold for pivot detection and real-time reversal projections, this original methodology and customizable feature set offer traders a versatile edge for making informed trading decisions.

Confluence Buy-Sell Indicator with Fibonacci The script is a "Confluence Indicator with Fibonacci" designed to work on the TradingView platform. This indicator combines multiple technical analysis strategies to generate buy and sell signals based on user-defined confluence criteria. Here's a breakdown of its features:
Confluence Criteria: Users can enable or disable various strategies like MACD, RSI, Bollinger Bands, Divergence, Fibonacci, and Moving Average. The number of strategies that need to align for a signal to be generated can be set by the user.
Strategies Included:
MACD Strategy: Uses the Moving Average Convergence Divergence method to identify buy/sell opportunities.
RSI Strategy: Utilizes the Relative Strength Index to detect overbought or oversold conditions.
Bollinger Bands Strategy: Incorporates Bollinger Bands to identify volatility and potential buy/sell signals.
Divergence Strategy: A basic implementation that detects bullish and bearish divergences using the RSI.
Fibonacci Strategy: Uses Fibonacci retracement levels to determine potential support and resistance levels.
Moving Average Strategy: Employs a crossover system between the 50-period and 200-period simple moving averages.
Additional Features:
Support & Resistance: Identifies major support and resistance levels from the last 50 bars.
Pivot Points: Calculates pivot points to determine potential turning points.
Stop Loss Levels: Automatically calculates and plots stop-loss levels for buy and sell signals.
NYC Midnight Level: Option to display the New York City midnight price level.
Visualization: Plots buy and sell signals on the chart with green and red markers respectively.
Adequate Category:
"Technical Analysis Indicators & Overlays" or "Strategy & Scripting Tools".

Liquidity Concepts [BigBeluga]The Liquidity Concepts indicator is designed to represent the liquidity on the chart using pivot points as potential stop-losses / liquidity grabs.
The indicator is facilitated by a market structure detector and pivot points to identify resting liquidity / stop-loss levels.
A liquidity grab or a stop-loss hunt is when retail traders place their stop-loss orders at recent highs / most recent highs or lows. This is a spot where big players attempt to push the market to trigger all the stop-loss orders and gain a better entry in their favor.
🔶 CALCULATION
The indicator uses the Higher Lower script made by @LonesomeTheBlue to determine these pivot points. When a pivot point is formed, it is displayed on the chart with the corresponding symbol (HH - HL - LH - LL). When one of these points is broken, a line is drawn between the pivot point and the candle that broke it.
A liquidity grab is only recognized after it has occurred, and it is represented with a box showing all the candles that were involved in the sweep / stop-loss hunt.
A pivot point is established only after the selected lookback period and cannot be printed beforehand in any manner. This ensures that it captures the highest point within the lookback period following the candle formation.
An HL (Higher Low) point is established when it is lower than an HH (Higher High) point, whereas an LH (Lower High) point is established when it is higher than an LL (Lower Low) point.
Boxes are formed in two different types: Major and Minor.
- Major boxes occur when LH or HL points are breached, with their high or low point crossing above or below in the specific lookback period.
- Minor boxes occur when HH or LL points are breached, with their high or low point crossing above or below in the specific lookback period.
Minor points are less efficient since they represent key highs and lows, and before taking out those liquidity levels, the HL and LH points should be cleared.
Representation of Pivot Point Formation:
Liquidity wicks are a minor representation of a stop-loss hunt during the retracement of a pivot point. This means that a pivot point is broken only by the wick and not by the entire body.
Bigger wick = more liquidity
Lower wick = less liquidity
Liquidity wicks can be used as trade confirmation or targets for your entry to enhance accuracy.
Users have the option to display candle coloring based on the currently detected trend.
🔶 VERIFICATION
Users have the option to specify the verification length for when the liquidity should occur. This means that if the length is set to 7, the indicator will search for the liquidity formation within the last 7 candles; otherwise, it will be considered invalid.
🔶 CONCEPTS
The whole idea is to help find possible zone of stop loss hunting helping having a better entry in our trading, we can utilize a lot more tools, and this shoud be used as confluence only
🔶 OPTIONS
Users have complete control over the settings, allowing them to:
- Disable pivot points.
- Disable the display of boxes.
- Disable liquidity wicks.
- Customize colors to their preferences.
- Adjust lookback settings for historical data analysis.
- Modify candle coloring settings.
- Adjust the text size of labels for better readability and customization.
🔶 RECAP
Box => Represents liquidity formation / stop-loss hunt
- Minor Box HH / LL point
- Major Box LH / HL point
Liquidity Wicks => Formed when a pivot point is broken only by the wick
BOS / CHoCH => Calculated using the pivot points from the @LonesomeTheBlue script
🔶 RELATED SCRIPTS
Price Action Concepts =>

Market Smith IndicatorsMarket Smith has a collection of tools that are useful for identifying stocks. On their charts they have a 21/50/200 day moving averages, high and low pivot points, a relative strength line, and a relative strength rating. This script contains indicators for the following:
21/50/200 Day Moving Averages
High and Low pivot points
A Relative Strength line
A Relative Strength rating
21/50/200 Day Moving Averages
The 21/50/200 Day moving averages are simple moving averages. They are visible in any chart increment but to use them properly you need to set you charts to be by day. Labels will appear on the right of the lines to show that they are representative of 21/50/200 day moving averages.
High and Low pivot points
The High and Low pivot points are green for high pivot points and red for low points. They are show in the Market Smith style with the numbers simply above the pivot points.
Relative Strength line
The Relative Strength line is a line that shows the strength of the stock compared to the S&P 500. In this case we utilize the SPX ticker to compare the stock to. This line is almost identical to the Market Smith tool and is an excellent tool to determine how a stock is doing compared to the market. When movements in the stock and shown with sideways trending of the RS line that means that the stock is following the market. When a stock is outperforming the market the RS line will follow.
Relative Strength rating
Thank you to ©Fred6724 for the RS Rating inspiration. They wrote excellent open source code for a RS Rating comparable to Market Smith. As the RS Rating in Market Smith is not open source it is difficult to know exactly how it is being calculated. After simplifying Fred's code and building upon a few ideas I had I compared the RS Rating to multiple Market Smith Ratings. The rating is close but often off by multiple points. If there is anyone who has a better idea on how to get this rating or how to improve on the code please send me a PM or fork this project. This rating is a good indicator to see how a certain stock compares to other stocks in the market. In Market Smith they are able to utilize their database to compare it to all other stocks. Since we do not have access to the same tools we are only able to compare it to the percentage of stocks above the 200, 150, 100, 50, and 20 day moving average.
Using these tools together are a small fraction what make people like Bill O'neill and Jim Roppel so successful. I plan on updating the RS Rating as I continue to work on this project so if there is anyone who has ideas then please send me a PM. Ultimately the goal of this project is to have a solution that is identical to Market Smith.

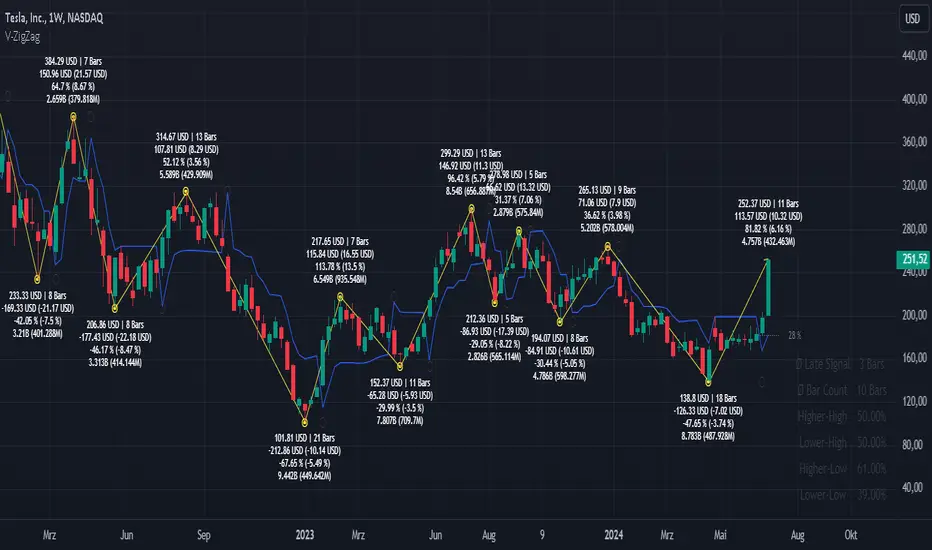
Moving Average Based Zig ZagMoving Average Based Zig Zag differs from the traditional Zig Zag indicator in that pivot points are determined by a moving average, Volume Weighted Hull Moving Average, rather than looking for the highest or lowest point in a left / right period.
Settings
Source: the source for the pivot points.
Moving Average Length: the length of the Volume Weighted Hull Moving Average, increase for longer zig zags, decrease for shorter zig zags.
Usage
Like all Zig Zag indicators, the Moving Average Based Zig Zag is not intended to be used as a live trading tool. This indicator is intended to be an alternative way of determining pivot points on your chart. Pivot points can be used for a multitude of different analytical techniques. One may use pivot points in order to draw potential support and resistance lines, trend lines or chart patterns. Additionally, pivot points can be used to determine variations of highs and lows important to market structure analysis such as break of structure or change of character.
Details
The moving average used is a Volume Weighted Hull Moving Average, this particular moving average was used due to it's relatively low-lag characteristics when compared to an Exponential Moving Average, additionally by considering volume in the moving average calculation, insignificant pivot points can be further filtered.
Rather than using built-in functions `ta.pivothigh()` and `ta.pivotlow()` to determine pivot points, this indicator waits for the moving average to pivot then searches for the highest or lowest value from the bar index of the moving average pivot to the bar index of the previous found price pivot. This method of determining pivots provides a more dynamic approach to determining pivot points.
Volatility ZigZagIt calculates and plots zigzag lines based on volatility and price movements. It has various inputs for customization, allowing you to adjust parameters like source data, length, deviation, line styling, and labeling options.
The indicator identifies pivot points in the price movement, drawing lines between these pivots based on the deviation from certain price levels or volatility measures.
The script labels various data points at the ZigZag pivot points on the chart. These labels provide information about different aspects of the price movement and volume around these pivot points. Here's a breakdown of what gets labeled:
Price Change: Indicates the absolute and average percentage change between the two pivot points. It displays the absolute or relative change in price as a percentage. Additionally, the average absolute price increase or the average rate of increase can also be labeled.
Volume: Shows the total volume and average volume between the two pivot points.
Number of Bars: Indicates the number of bars between the current and the last pivot point.
Reversal Price: Displays the price of the reversal point (the previous pivot).
Pivot Support & Resistance [DeltaAlgo]Pivot Support & Resistance Indicator - DeltaAlgo
Concept:
The "Pivot Support & Resistance" indicator is designed to help traders identify and visualize key support and resistance levels based on pivot points. It calculates and plots lines representing these levels on a price chart. This indicator's concept is rooted in the idea that pivot points can act as significant price reference points, which can be instrumental in making trading decisions.
Settings:
Pivot Period: Users can customize the period for calculating pivot points. This period determines how many bars are considered when calculating support and resistance levels.
Maximum Lines: The indicator allows traders to set a maximum number of support and resistance lines that will be displayed. When the maximum is reached, older lines are removed to keep the chart uncluttered.
Line Colors and Width: Users can choose the colors and width for both the support and resistance lines to tailor the indicator's appearance to their preferences.
Use Case:
The "Pivot Support & Resistance" indicator is beneficial for traders who employ pivot points in their technical analysis and trading strategies. It aids in identifying potential reversal and breakout levels, which can inform trading decisions. Traders can use this indicator to:
Identify key price levels: The indicator highlights significant support and resistance levels based on pivot points.
Plan entries and exits: Traders can incorporate these levels into their trading strategies to make more informed decisions about when to enter or exit trades.
Manage risk: Knowing where support and resistance levels are can help traders set stop-loss and take-profit orders more effectively.
This indicator simplifies the process of identifying and visualizing pivot-based support and resistance levels, making it a valuable tool for traders who rely on these levels in their technical analysis. It helps streamline the decision-making process and enhances overall trading effectiveness.

[JL] Supertrend Zone Pivot Point with zigzag fibThis is an open-source Pine script that generates a Supertrend Zone Pivot Point with Zigzag Fib indicator for TradingView. The indicator displays the Supertrend Zone, pivot points, and Fibonacci levels on the chart.
One of the unique features of this indicator is that it uses a Zigzag that does not repaint, ensuring accurate high and low points for the pivot points.
Another feature is that when the Supertrend is in an uptrend, only the highest points are taken as pivot points, and when it's in a downtrend, only the lowest points are taken as pivot points.
The Fibonacci levels are calculated based on the previous high and low pivot points, with labels displaying the corresponding levels on the chart.
The indicator also includes options to show/hide the Zigzag and Fibonacci levels.
Overall, this indicator is useful for identifying key pivot points and Fibonacci levels in the Supertrend Zone, providing valuable information for traders to make informed decisions.

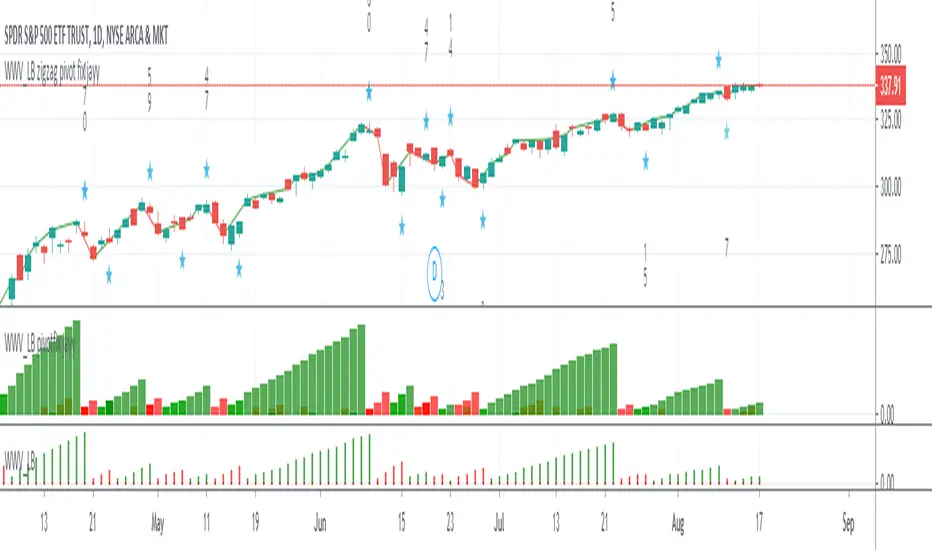
WWV_LB zigzag pivot fix jayyThis is a zigzag version of LazyBear's WWV_LB. In order to plot the WWV_LB as a zigzag, it made sense to me to set the zigzag pivot at the true WWV_LB low or high pivot bars as opposed to the "pivot" bars plotted by the original WWV_LB script. The pivot point identified in the WWV_LB script is actually the point at which a wave reversal is confirmed as opposed to the true script pivot point. Confirmation of a wave reversal can, at times, lag the true pivot by a few bars especially as trendDetectionLength values increase above "1". The WWV_LB script calculates cumulative volume from wave reversal confirmation bar to wave reversal confirmation bar as opposed to the actual/true WWV_LB reversal pivot bar to reversal pivot bar. As such the waves plotted by the original and this pivot fixed scripts not only look slightly different but can also have different cumulative volumes. Confirmation of a wave reversal can lag a few bars behind the true pivot point.
The following critical lines of the original WWV_LB script determine when a wave reverses, both the true pivot and the confirmation point:mov = close>close ? 1 : close
Ultimate RSI [captainua]Ultimate RSI
Overview
This indicator combines multiple RSI calculations with volume analysis, divergence detection, and trend filtering to provide a comprehensive RSI-based trading system. The script calculates RSI using three different periods (6, 14, 24) and applies various smoothing methods to reduce noise while maintaining responsiveness. The combination of these features creates a multi-layered confirmation system that reduces false signals by requiring alignment across multiple indicators and timeframes.
The script includes optimized configuration presets for instant setup: Scalping, Day Trading, Swing Trading, and Position Trading. Simply select a preset to instantly configure all settings for your trading style, or use Custom mode for full manual control. All settings include automatic input validation to prevent configuration errors and ensure optimal performance.
Configuration Presets
The script includes preset configurations optimized for different trading styles, allowing you to instantly configure the indicator for your preferred trading approach. Simply select a preset from the "Configuration Preset" dropdown menu:
- Scalping: Optimized for fast-paced trading with shorter RSI periods (4, 7, 9) and minimal smoothing. Noise reduction is automatically disabled, and momentum confirmation is disabled to allow faster signal generation. Designed for quick entries and exits in volatile markets.
- Day Trading: Balanced configuration for intraday trading with moderate RSI periods (6, 9, 14) and light smoothing. Momentum confirmation is enabled for better signal quality. Ideal for day trading strategies requiring timely but accurate signals.
- Swing Trading: Configured for medium-term positions with standard RSI periods (14, 14, 21) and moderate smoothing. Provides smoother signals suitable for swing trading timeframes. All noise reduction features remain active.
- Position Trading: Optimized for longer-term trades with extended RSI periods (24, 21, 28) and heavier smoothing. Filters are configured for highest-quality signals. Best for position traders holding trades over multiple days or weeks.
- Custom: Full manual control over all settings. All input parameters are available for complete customization. This is the default mode and maintains full backward compatibility with previous versions.
When a preset is selected, it automatically adjusts RSI periods, smoothing lengths, and filter settings to match the trading style. The preset configurations ensure optimal settings are applied instantly, eliminating the need for manual configuration. All settings can still be manually overridden if needed, providing flexibility while maintaining ease of use.
Input Validation and Error Prevention
The script includes comprehensive input validation to prevent configuration errors:
- Cross-Input Validation: Smoothing lengths are automatically validated to ensure they are always less than their corresponding RSI period length. If you set a smoothing length greater than or equal to the RSI length, the script automatically adjusts it to (RSI Length - 1). This prevents logical errors and ensures valid configurations.
- Input Range Validation: All numeric inputs have minimum and maximum value constraints enforced by TradingView's input system, preventing invalid parameter values.
- Smart Defaults: Preset configurations use validated default values that are tested and optimized for each trading style. When switching between presets, all related settings are automatically updated to maintain consistency.
Core Calculations
Multi-Period RSI:
The script calculates RSI using the standard Wilder's RSI formula: RSI = 100 - (100 / (1 + RS)), where RS = Average Gain / Average Loss over the specified period. Three separate RSI calculations run simultaneously:
- RSI(6): Uses 6-period lookback for high sensitivity to recent price changes, useful for scalping and early signal detection
- RSI(14): Standard 14-period RSI for balanced analysis, the most commonly used RSI period
- RSI(24): Longer 24-period RSI for trend confirmation, provides smoother signals with less noise
Each RSI can be smoothed using EMA, SMA, RMA (Wilder's smoothing), WMA, or Zero-Lag smoothing. Zero-Lag smoothing uses the formula: ZL-RSI = RSI + (RSI - RSI ) to reduce lag while maintaining signal quality. You can apply individual smoothing lengths to each RSI period, or use global smoothing where all three RSIs share the same smoothing length.
Dynamic Overbought/Oversold Thresholds:
Static thresholds (default 70/30) are adjusted based on market volatility using ATR. The formula: Dynamic OB = Base OB + (ATR × Volatility Multiplier × Base Percentage / 100), Dynamic OS = Base OS - (ATR × Volatility Multiplier × Base Percentage / 100). This adapts to volatile markets where traditional 70/30 levels may be too restrictive. During high volatility, the dynamic thresholds widen, and during low volatility, they narrow. The thresholds are clamped between 0-100 to remain within RSI bounds. The ATR is cached for performance optimization, updating on confirmed bars and real-time bars.
Adaptive RSI Calculation:
An adaptive RSI adjusts the standard RSI(14) based on current volatility relative to average volatility. The calculation: Adaptive Factor = (Current ATR / SMA of ATR over 20 periods) × Volatility Multiplier. If SMA of ATR is zero (edge case), the adaptive factor defaults to 0. The adaptive RSI = Base RSI × (1 + Adaptive Factor), clamped to 0-100. This makes the indicator more responsive during high volatility periods when traditional RSI may lag. The adaptive RSI is used for signal generation (buy/sell signals) but is not plotted on the chart.
Overbought/Oversold Fill Zones:
The script provides visual fill zones between the RSI line and the threshold lines when RSI is in overbought or oversold territory. The fill logic uses inclusive conditions: fills are shown when RSI is currently in the zone OR was in the zone on the previous bar. This ensures complete coverage of entry and exit boundaries. A minimum gap of 0.1 RSI points is maintained between the RSI plot and threshold line to ensure reliable polygon rendering in TradingView. The fill uses invisible plots at the threshold levels and the RSI value, with the fill color applied between them. You can select which RSI (6, 14, or 24) to use for the fill zones.
Divergence Detection
Regular Divergence:
Bullish divergence: Price makes a lower low (current low < lowest low from previous lookback period) while RSI makes a higher low (current RSI > lowest RSI from previous lookback period). Bearish divergence: Price makes a higher high (current high > highest high from previous lookback period) while RSI makes a lower high (current RSI < highest RSI from previous lookback period). The script compares current price/RSI values to the lowest/highest values from the previous lookback period using ta.lowest() and ta.highest() functions with index to reference the previous period's extreme.
Pivot-Based Divergence:
An enhanced divergence detection method that uses actual pivot points instead of simple lowest/highest comparisons. This provides more accurate divergence detection by identifying significant pivot lows/highs in both price and RSI. The pivot-based method uses a tolerance-based approach with configurable constants: 1% tolerance for price comparisons (priceTolerancePercent = 0.01) and 1.0 RSI point absolute tolerance for RSI comparisons (pivotTolerance = 1.0). Minimum divergence threshold is 1.0 RSI point (minDivergenceThreshold = 1.0). It looks for two recent pivot points and compares them: for bullish divergence, price makes a lower low (at least 1% lower) while RSI makes a higher low (at least 1.0 point higher). This method reduces false divergences by requiring actual pivot points rather than just any low/high within a period. When enabled, pivot-based divergence replaces the traditional method for more accurate signal generation.
Strong Divergence:
Regular divergence is confirmed by an engulfing candle pattern. Bullish engulfing requires: (1) Previous candle is bearish (close < open ), (2) Current candle is bullish (close > open), (3) Current close > previous open, (4) Current open < previous close. Bearish engulfing is the inverse: previous bullish, current bearish, current close < previous open, current open > previous close. Strong divergence signals are marked with visual indicators (🐂 for bullish, 🐻 for bearish) and have separate alert conditions.
Hidden Divergence:
Continuation patterns that signal trend continuation rather than reversal. Bullish hidden divergence: Price makes a higher low (current low > lowest low from previous period) but RSI makes a lower low (current RSI < lowest RSI from previous period). Bearish hidden divergence: Price makes a lower high (current high < highest high from previous period) but RSI makes a higher high (current RSI > highest RSI from previous period). These patterns indicate the trend is likely to continue in the current direction.
Volume Confirmation System
Volume threshold filtering requires current volume to exceed the volume SMA multiplied by the threshold factor. The formula: Volume Confirmed = Volume > (Volume SMA × Threshold). If the threshold is set to 0.1 or lower, volume confirmation is effectively disabled (always returns true). This allows you to use the indicator without volume filtering if desired.
Volume Climax is detected when volume exceeds: Volume SMA + (Volume StdDev × Multiplier). This indicates potential capitulation moments where extreme volume accompanies price movements. Volume Dry-Up is detected when volume falls below: Volume SMA - (Volume StdDev × Multiplier), indicating low participation periods that may produce unreliable signals. The volume SMA is cached for performance, updating on confirmed and real-time bars.
Multi-RSI Synergy
The script generates signals when multiple RSI periods align in overbought or oversold zones. This creates a confirmation system that reduces false signals. In "ALL" mode, all three RSIs (6, 14, 24) must be simultaneously above the overbought threshold OR all three must be below the oversold threshold. In "2-of-3" mode, any two of the three RSIs must align in the same direction. The script counts how many RSIs are in each zone: twoOfThreeOB = ((rsi6OB ? 1 : 0) + (rsi14OB ? 1 : 0) + (rsi24OB ? 1 : 0)) >= 2.
Synergy signals require: (1) Multi-RSI alignment (ALL or 2-of-3), (2) Volume confirmation, (3) Reset condition satisfied (enough bars since last synergy signal), (4) Additional filters passed (RSI50, Trend, ADX, Volume Dry-Up avoidance). Separate reset conditions track buy and sell signals independently. The reset condition uses ta.barssince() to count bars since the last trigger, returning true if the condition never occurred (allowing first signal) or if enough bars have passed.
Regression Forecasting
The script uses historical RSI values to forecast future RSI direction using four methods. The forecast horizon is configurable (1-50 bars ahead). Historical data is collected into an array, and regression coefficients are calculated based on the selected method.
Linear Regression: Calculates the least-squares fit line (y = mx + b) through the last N RSI values. The calculation: meanX = sumX / horizon, meanY = sumY / horizon, denominator = sumX² - horizon × meanX², m = (sumXY - horizon × meanX × meanY) / denominator, b = meanY - m × meanX. The forecast projects this line forward: forecast = b + m × i for i = 1 to horizon.
Polynomial Regression: Fits a quadratic curve (y = ax² + bx + c) to capture non-linear trends. The system of equations is solved using Cramer's rule with a 3×3 determinant. If the determinant is too small (< 0.0001), the system falls back to linear regression. Coefficients are calculated by solving: n×c + sumX×b + sumX²×a = sumY, sumX×c + sumX²×b + sumX³×a = sumXY, sumX²×c + sumX³×b + sumX⁴×a = sumX²Y. Note: Due to the O(n³) computational complexity of polynomial regression, the forecast horizon is automatically limited to a maximum of 20 bars when using polynomial regression to maintain optimal performance. If you set a horizon greater than 20 bars with polynomial regression, it will be automatically capped at 20 bars.
Exponential Smoothing: Applies exponential smoothing with adaptive alpha = 2/(horizon+1). The smoothing iterates from oldest to newest value: smoothed = alpha × series + (1 - alpha) × smoothed. Trend is calculated by comparing current smoothed value to an earlier smoothed value (at 60% of horizon): trend = (smoothed - earlierSmoothed) / (horizon - earlierIdx). Forecast: forecast = base + trend × i.
Moving Average: Uses the difference between short MA (horizon/2) and long MA (horizon) to estimate trend direction. Trend = (maShort - maLong) / (longLen - shortLen). Forecast: forecast = maShort + trend × i.
Confidence bands are calculated using RMSE (Root Mean Squared Error) of historical forecast accuracy. The error calculation compares historical values with forecast values: RMSE = sqrt(sumSquaredError / count). If insufficient data exists, it falls back to calculating standard deviation of recent RSI values. Confidence bands = forecast ± (RMSE × confidenceLevel). All forecast values and confidence bands are clamped to 0-100 to remain within RSI bounds. The regression functions include comprehensive safety checks: horizon validation (must not exceed array size), empty array handling, edge case handling for horizon=1 scenarios, division-by-zero protection, and bounds checking for all array access operations to prevent runtime errors.
Strong Top/Bottom Detection
Strong buy signals require three conditions: (1) RSI is at its lowest point within the bottom period: rsiVal <= ta.lowest(rsiVal, bottomPeriod), (2) RSI is below the oversold threshold minus a buffer: rsiVal < (oversoldThreshold - rsiTopBottomBuffer), where rsiTopBottomBuffer = 2.0 RSI points, (3) The absolute difference between current RSI and the lowest RSI exceeds the threshold value: abs(rsiVal - ta.lowest(rsiVal, bottomPeriod)) > threshold. This indicates a bounce from extreme levels with sufficient distance from the absolute low.
Strong sell signals use the inverse logic: RSI at highest point, above overbought threshold + rsiTopBottomBuffer (2.0 RSI points), and difference from highest exceeds threshold. Both signals also require: volume confirmation, reset condition satisfied (separate reset for buy vs sell), and all additional filters passed (RSI50, Trend, ADX, Volume Dry-Up avoidance).
The reset condition uses separate logic for buy and sell: resetCondBuy checks bars since isRSIAtBottom, resetCondSell checks bars since isRSIAtTop. This ensures buy signals reset based on bottom conditions and sell signals reset based on top conditions, preventing incorrect signal blocking.
Filtering System
RSI(50) Filter: Only allows buy signals when RSI(14) > 50 (bullish momentum) and sell signals when RSI(14) < 50 (bearish momentum). This filter ensures you're buying in uptrends and selling in downtrends from a momentum perspective. The filter is optional and can be disabled. Recommended to enable for noise reduction.
Trend Filter: Uses a long-term EMA (default 200) to determine trend direction. Buy signals require price above EMA, sell signals require price below EMA. The EMA slope is calculated as: emaSlope = ema - ema . Optional EMA slope filter additionally requires the EMA to be rising (slope > 0) for buy signals or falling (slope < 0) for sell signals. This provides stronger trend confirmation by requiring both price position and EMA direction.
ADX Filter: Uses the Directional Movement Index (calculated via ta.dmi()) to measure trend strength. Signals only fire when ADX exceeds the threshold (default 20), indicating a strong trend rather than choppy markets. The ADX calculation uses separate length and smoothing parameters. This filter helps avoid signals during sideways/consolidation periods.
Volume Dry-Up Avoidance: Prevents signals during periods of extremely low volume relative to average. If volume dry-up is detected and the filter is enabled, signals are blocked. This helps avoid unreliable signals that occur during low participation periods.
RSI Momentum Confirmation: Requires RSI to be accelerating in the signal direction before confirming signals. For buy signals, RSI must be consistently rising (recovering from oversold) over the lookback period. For sell signals, RSI must be consistently falling (declining from overbought) over the lookback period. The momentum check verifies that all consecutive changes are in the correct direction AND the cumulative change is significant. This filter ensures signals only fire when RSI momentum aligns with the signal direction, reducing false signals from weak momentum.
Multi-Timeframe Confirmation: Requires higher timeframe RSI to align with the signal direction. For buy signals, current RSI must be below the higher timeframe RSI by at least the confirmation threshold. For sell signals, current RSI must be above the higher timeframe RSI by at least the confirmation threshold. This ensures signals align with the larger trend context, reducing counter-trend trades. The higher timeframe RSI is fetched using request.security() from the selected timeframe.
All filters use the pattern: filterResult = not filterEnabled OR conditionMet. This means if a filter is disabled, it always passes (returns true). Filters can be combined, and all must pass for a signal to fire.
RSI Centerline and Period Crossovers
RSI(50) Centerline Crossovers: Detects when the selected RSI source crosses above or below the 50 centerline. Bullish crossover: ta.crossover(rsiSource, 50), bearish crossover: ta.crossunder(rsiSource, 50). You can select which RSI (6, 14, or 24) to use for these crossovers. These signals indicate momentum shifts from bearish to bullish (above 50) or bullish to bearish (below 50).
RSI Period Crossovers: Detects when different RSI periods cross each other. Available pairs: RSI(6) × RSI(14), RSI(14) × RSI(24), or RSI(6) × RSI(24). Bullish crossover: fast RSI crosses above slow RSI (ta.crossover(rsiFast, rsiSlow)), indicating momentum acceleration. Bearish crossover: fast RSI crosses below slow RSI (ta.crossunder(rsiFast, rsiSlow)), indicating momentum deceleration. These crossovers can signal shifts in momentum before price moves.
StochRSI Calculation
Stochastic RSI applies the Stochastic oscillator formula to RSI values instead of price. The calculation: %K = ((RSI - Lowest RSI) / (Highest RSI - Lowest RSI)) × 100, where the lookback is the StochRSI length. If the range is zero, %K defaults to 50.0. %K is then smoothed using SMA with the %K smoothing length. %D is calculated as SMA of smoothed %K with the %D smoothing length. All values are clamped to 0-100. You can select which RSI (6, 14, or 24) to use as the source for StochRSI calculation.
RSI Bollinger Bands
Bollinger Bands are applied to RSI(14) instead of price. The calculation: Basis = SMA(RSI(14), BB Period), StdDev = stdev(RSI(14), BB Period), Upper = Basis + (StdDev × Deviation Multiplier), Lower = Basis - (StdDev × Deviation Multiplier). This creates dynamic zones around RSI that adapt to RSI volatility. When RSI touches or exceeds the bands, it indicates extreme conditions relative to recent RSI behavior.
Noise Reduction System
The script includes a comprehensive noise reduction system to filter false signals and improve accuracy. When enabled, signals must pass multiple quality checks:
Signal Strength Requirement: RSI must be at least X points away from the centerline (50). For buy signals, RSI must be at least X points below 50. For sell signals, RSI must be at least X points above 50. This ensures signals only trigger when RSI is significantly in oversold/overbought territory, not just near neutral.
Extreme Zone Requirement: RSI must be deep in the OB/OS zone. For buy signals, RSI must be at least X points below the oversold threshold. For sell signals, RSI must be at least X points above the overbought threshold. This ensures signals only fire in extreme conditions where reversals are more likely.
Consecutive Bar Confirmation: The signal condition must persist for N consecutive bars before triggering. This reduces false signals from single-bar spikes or noise. The confirmation checks that the signal condition was true for all bars in the lookback period.
Zone Persistence (Optional): Requires RSI to remain in the OB/OS zone for N consecutive bars, not just touch it. This ensures RSI is truly in an extreme state rather than just briefly touching the threshold. When enabled, this provides stricter filtering for higher-quality signals.
RSI Slope Confirmation (Optional): Requires RSI to be moving in the expected signal direction. For buy signals, RSI should be rising (recovering from oversold). For sell signals, RSI should be falling (declining from overbought). This ensures momentum is aligned with the signal direction. The slope is calculated by comparing current RSI to RSI N bars ago.
All noise reduction filters can be enabled/disabled independently, allowing you to customize the balance between signal frequency and accuracy. The default settings provide a good balance, but you can adjust them based on your trading style and market conditions.
Alert System
The script includes separate alert conditions for each signal type: buy/sell (adaptive RSI crossovers), divergence (regular, strong, hidden), crossovers (RSI50 centerline, RSI period crossovers), synergy signals, and trend breaks. Each alert type has its own alertcondition() declaration with a unique title and message.
An optional cooldown system prevents alert spam by requiring a minimum number of bars between alerts of the same type. The cooldown check: canAlert = na(lastAlertBar) OR (bar_index - lastAlertBar >= cooldownBars). If the last alert bar is na (first alert), it always allows the alert. Each alert type maintains its own lastAlertBar variable, so cooldowns are independent per signal type. The default cooldown is 10 bars, which is recommended for noise reduction.
Higher Timeframe RSI
The script can display RSI from a higher timeframe using request.security(). This allows you to see the RSI context from a larger timeframe (e.g., daily RSI on an hourly chart). The higher timeframe RSI uses RSI(14) calculation from the selected timeframe. This provides context for the current timeframe's RSI position relative to the larger trend.
RSI Pivot Trendlines
The script can draw trendlines connecting pivot highs and lows on RSI(6). This feature helps visualize RSI trends and identify potential trend breaks.
Pivot Detection: Pivots are detected using a configurable period. The script can require pivots to have minimum strength (RSI points difference from surrounding bars) to filter out weak pivots. Lower minPivotStrength values detect more pivots (more trendlines), while higher values detect only stronger pivots (fewer but more significant trendlines). Pivot confirmation is optional: when enabled, the script waits N bars to confirm the pivot remains the extreme, reducing repainting. Pivot confirmation functions (f_confirmPivotLow and f_confirmPivotHigh) are always called on every bar for consistency, as recommended by TradingView. When pivot bars are not available (na), safe default values are used, and the results are then used conditionally based on confirmation settings. This ensures consistent calculations and prevents calculation inconsistencies.
Trendline Drawing: Uptrend lines connect confirmed pivot lows (green), and downtrend lines connect confirmed pivot highs (red). By default, only the most recent trendline is shown (old trendlines are deleted when new pivots are confirmed). This keeps the chart clean and uncluttered. If "Keep Historical Trendlines" is enabled, the script preserves up to N historical trendlines (configurable via "Max Trendlines to Keep", default 5). When historical trendlines are enabled, old trendlines are saved to arrays instead of being deleted, allowing you to see multiple trendlines simultaneously for better trend analysis. The arrays are automatically limited to prevent memory accumulation.
Trend Break Detection: Signals are generated when RSI breaks above or below trendlines. Uptrend breaks (RSI crosses below uptrend line) generate buy signals. Downtrend breaks (RSI crosses above downtrend line) generate sell signals. Optional trend break confirmation requires the break to persist for N bars and optionally include volume confirmation. Trendline angle filtering can exclude flat/weak trendlines from generating signals (minTrendlineAngle > 0 filters out weak/flat trendlines).
How Components Work Together
The combination of multiple RSI periods provides confirmation across different timeframes, reducing false signals. RSI(6) catches early moves, RSI(14) provides balanced signals, and RSI(24) confirms longer-term trends. When all three align (synergy), it indicates strong consensus across timeframes.
Volume confirmation ensures signals occur with sufficient market participation, filtering out low-volume false breakouts. Volume climax detection identifies potential reversal points, while volume dry-up avoidance prevents signals during unreliable low-volume periods.
Trend filters align signals with the overall market direction. The EMA filter ensures you're trading with the trend, and the EMA slope filter adds an additional layer by requiring the trend to be strengthening (rising EMA for buys, falling EMA for sells).
ADX filter ensures signals only fire during strong trends, avoiding choppy/consolidation periods. RSI(50) filter ensures momentum alignment with the trade direction.
Momentum confirmation requires RSI to be accelerating in the signal direction, ensuring signals only fire when momentum is aligned. Multi-timeframe confirmation ensures signals align with higher timeframe trends, reducing counter-trend trades.
Divergence detection identifies potential reversals before they occur, providing early warning signals. Pivot-based divergence provides more accurate detection by using actual pivot points. Hidden divergence identifies continuation patterns, useful for trend-following strategies.
The noise reduction system combines multiple filters (signal strength, extreme zone, consecutive bars, zone persistence, RSI slope) to significantly reduce false signals. These filters work together to ensure only high-quality signals are generated.
The synergy system requires alignment across all RSI periods for highest-quality signals, significantly reducing false positives. Regression forecasting provides forward-looking context, helping anticipate potential RSI direction changes.
Pivot trendlines provide visual trend analysis and can generate signals when RSI breaks trendlines, indicating potential reversals or continuations.
Reset conditions prevent signal spam by requiring a minimum number of bars between signals. Separate reset conditions for buy and sell signals ensure proper signal management.
Usage Instructions
Configuration Presets (Recommended): The script includes optimized preset configurations for instant setup. Simply select your trading style from the "Configuration Preset" dropdown:
- Scalping Preset: RSI(4, 7, 9) with minimal smoothing. Noise reduction disabled, momentum confirmation disabled for fastest signals.
- Day Trading Preset: RSI(6, 9, 14) with light smoothing. Momentum confirmation enabled for better signal quality.
- Swing Trading Preset: RSI(14, 14, 21) with moderate smoothing. Balanced configuration for medium-term trades.
- Position Trading Preset: RSI(24, 21, 28) with heavier smoothing. Optimized for longer-term positions with all filters active.
- Custom Mode: Full manual control over all settings. Default behavior matches previous script versions.
Presets automatically configure RSI periods, smoothing lengths, and filter settings. You can still manually adjust any setting after selecting a preset if needed.
Getting Started: The easiest way to get started is to select a configuration preset matching your trading style (Scalping, Day Trading, Swing Trading, or Position Trading) from the "Configuration Preset" dropdown. This instantly configures all settings for optimal performance. Alternatively, use "Custom" mode for full manual control. The default configuration (Custom mode) shows RSI(6), RSI(14), and RSI(24) with their default smoothing. Overbought/oversold fill zones are enabled by default.
Customizing RSI Periods: Adjust the RSI lengths (6, 14, 24) based on your trading timeframe. Shorter periods (6) for scalping, standard (14) for day trading, longer (24) for swing trading. You can disable any RSI period you don't need.
Smoothing Selection: Choose smoothing method based on your needs. EMA provides balanced smoothing, RMA (Wilder's) is traditional, Zero-Lag reduces lag but may increase noise. Adjust smoothing lengths individually or use global smoothing for consistency. Note: Smoothing lengths are automatically validated to ensure they are always less than the corresponding RSI period length. If you set smoothing >= RSI length, it will be auto-adjusted to prevent invalid configurations.
Dynamic OB/OS: The dynamic thresholds automatically adapt to volatility. Adjust the volatility multiplier and base percentage to fine-tune sensitivity. Higher values create wider thresholds in volatile markets.
Volume Confirmation: Set volume threshold to 1.2 (default) for standard confirmation, higher for stricter filtering, or 0.1 to disable volume filtering entirely.
Multi-RSI Synergy: Use "ALL" mode for highest-quality signals (all 3 RSIs must align), or "2-of-3" mode for more frequent signals. Adjust the reset period to control signal frequency.
Filters: Enable filters gradually to find your preferred balance. Start with volume confirmation, then add trend filter, then ADX for strongest confirmation. RSI(50) filter is useful for momentum-based strategies and is recommended for noise reduction. Momentum confirmation and multi-timeframe confirmation add additional layers of accuracy but may reduce signal frequency.
Noise Reduction: The noise reduction system is enabled by default with balanced settings. Adjust minSignalStrength (default 3.0) to control how far RSI must be from centerline. Increase requireConsecutiveBars (default 1) to require signals to persist longer. Enable requireZonePersistence and requireRsiSlope for stricter filtering (higher quality but fewer signals). Start with defaults and adjust based on your needs.
Divergence: Enable divergence detection and adjust lookback periods. Strong divergence (with engulfing confirmation) provides higher-quality signals. Hidden divergence is useful for trend-following strategies. Enable pivot-based divergence for more accurate detection using actual pivot points instead of simple lowest/highest comparisons. Pivot-based divergence uses tolerance-based matching (1% for price, 1.0 RSI point for RSI) for better accuracy.
Forecasting: Enable regression forecasting to see potential RSI direction. Linear regression is simplest, polynomial captures curves, exponential smoothing adapts to trends. Adjust horizon based on your trading timeframe. Confidence bands show forecast uncertainty - wider bands indicate less reliable forecasts.
Pivot Trendlines: Enable pivot trendlines to visualize RSI trends and identify trend breaks. Adjust pivot detection period (default 5) - higher values detect fewer but stronger pivots. Enable pivot confirmation (default ON) to reduce repainting. Set minPivotStrength (default 1.0) to filter weak pivots - lower values detect more pivots (more trendlines), higher values detect only stronger pivots (fewer trendlines). Enable "Keep Historical Trendlines" to preserve multiple trendlines instead of just the most recent one. Set "Max Trendlines to Keep" (default 5) to control how many historical trendlines are preserved. Enable trend break confirmation for more reliable break signals. Adjust minTrendlineAngle (default 0.0) to filter flat trendlines - set to 0.1-0.5 to exclude weak trendlines.
Alerts: Set up alerts for your preferred signal types. Enable cooldown to prevent alert spam. Each signal type has its own alert condition, so you can be selective about which signals trigger alerts.
Visual Elements and Signal Markers
The script uses various visual markers to indicate signals and conditions:
- "sBottom" label (green): Strong bottom signal - RSI at extreme low with strong buy conditions
- "sTop" label (red): Strong top signal - RSI at extreme high with strong sell conditions
- "SyBuy" label (lime): Multi-RSI synergy buy signal - all RSIs aligned oversold
- "SySell" label (red): Multi-RSI synergy sell signal - all RSIs aligned overbought
- 🐂 emoji (green): Strong bullish divergence detected
- 🐻 emoji (red): Strong bearish divergence detected
- 🔆 emoji: Weak divergence signals (if enabled)
- "H-Bull" label: Hidden bullish divergence
- "H-Bear" label: Hidden bearish divergence
- ⚡ marker (top of pane): Volume climax detected (extreme volume) - positioned at top for visibility
- 💧 marker (top of pane): Volume dry-up detected (very low volume) - positioned at top for visibility
- ↑ triangle (lime): Uptrend break signal - RSI breaks below uptrend line
- ↓ triangle (red): Downtrend break signal - RSI breaks above downtrend line
- Triangle up (lime): RSI(50) bullish crossover
- Triangle down (red): RSI(50) bearish crossover
- Circle markers: RSI period crossovers
All markers are positioned at the RSI value where the signal occurs, using location.absolute for precise placement.
Signal Priority and Interpretation
Signals are generated independently and can occur simultaneously. Higher-priority signals generally indicate stronger setups:
1. Multi-RSI Synergy signals (SyBuy/SySell) - Highest priority: Requires alignment across all RSI periods plus volume and filter confirmation. These are the most reliable signals.
2. Strong Top/Bottom signals (sTop/sBottom) - High priority: Indicates extreme RSI levels with strong bounce conditions. Requires volume confirmation and all filters.
3. Divergence signals - Medium-High priority: Strong divergence (with engulfing) is more reliable than regular divergence. Hidden divergence indicates continuation rather than reversal.
4. Adaptive RSI crossovers - Medium priority: Buy when adaptive RSI crosses below dynamic oversold, sell when it crosses above dynamic overbought. These use volatility-adjusted RSI for more accurate signals.
5. RSI(50) centerline crossovers - Medium priority: Momentum shift signals. Less reliable alone but useful when combined with other confirmations.
6. RSI period crossovers - Lower priority: Early momentum shift indicators. Can provide early warning but may produce false signals in choppy markets.
Best practice: Wait for multiple confirmations. For example, a synergy signal combined with divergence and volume climax provides the strongest setup.
Chart Requirements
For proper script functionality and compliance with TradingView requirements, ensure your chart displays:
- Symbol name: The trading pair or instrument name should be visible
- Timeframe: The chart timeframe should be clearly displayed
- Script name: "Ultimate RSI " should be visible in the indicator title
These elements help traders understand what they're viewing and ensure proper script identification. The script automatically includes this information in the indicator title and chart labels.
Performance Considerations
The script is optimized for performance:
- ATR and Volume SMA are cached using var variables, updating only on confirmed and real-time bars to reduce redundant calculations
- Forecast line arrays are dynamically managed: lines are reused when possible, and unused lines are deleted to prevent memory accumulation
- Calculations use efficient Pine Script functions (ta.rsi, ta.ema, etc.) which are optimized by TradingView
- Array operations are minimized where possible, with direct calculations preferred
- Polynomial regression automatically caps the forecast horizon at 20 bars (POLYNOMIAL_MAX_HORIZON constant) to prevent performance degradation, as polynomial regression has O(n³) complexity. This safeguard ensures optimal performance even with large horizon settings
- Pivot detection includes edge case handling to ensure reliable calculations even on early bars with limited historical data. Regression forecasting functions include comprehensive safety checks: horizon validation (must not exceed array size), empty array handling, edge case handling for horizon=1 scenarios, and division-by-zero protection in all mathematical operations
The script should perform well on all timeframes. On very long historical data, forecast lines may accumulate if the horizon is large; consider reducing the forecast horizon if you experience performance issues. The polynomial regression performance safeguard automatically prevents performance issues for that specific regression type.
Known Limitations and Considerations
- Forecast lines are forward-looking projections and should not be used as definitive predictions. They provide context but are not guaranteed to be accurate.
- Dynamic OB/OS thresholds can exceed 100 or go below 0 in extreme volatility scenarios, but are clamped to 0-100 range. This means in very volatile markets, the dynamic thresholds may not widen as much as the raw calculation suggests.
- Volume confirmation requires sufficient historical volume data. On new instruments or very short timeframes, volume calculations may be less reliable.
- Higher timeframe RSI uses request.security() which may have slight delays on some data feeds.
- Regression forecasting requires at least N bars of history (where N = forecast horizon) before it can generate forecasts. Early bars will not show forecast lines.
- StochRSI calculation requires the selected RSI source to have sufficient history. Very short RSI periods on new charts may produce less reliable StochRSI values initially.
Practical Use Cases
The indicator can be configured for different trading styles and timeframes:
Swing Trading: Select the "Swing Trading" preset for instant optimal configuration. This preset uses RSI periods (14, 14, 21) with moderate smoothing. Alternatively, manually configure: Use RSI(24) with Multi-RSI Synergy in "ALL" mode, combined with trend filter (EMA 200) and ADX filter. This configuration provides high-probability setups with strong confirmation across multiple RSI periods.
Day Trading: Select the "Day Trading" preset for instant optimal configuration. This preset uses RSI periods (6, 9, 14) with light smoothing and momentum confirmation enabled. Alternatively, manually configure: Use RSI(6) with Zero-Lag smoothing for fast signal detection. Enable volume confirmation with threshold 1.2-1.5 for reliable entries. Combine with RSI(50) filter to ensure momentum alignment. Strong top/bottom signals work well for day trading reversals.
Trend Following: Enable trend filter (EMA) and EMA slope filter for strong trend confirmation. Use RSI(14) or RSI(24) with ADX filter to avoid choppy markets. Hidden divergence signals are useful for trend continuation entries.
Reversal Trading: Focus on divergence detection (regular and strong) combined with strong top/bottom signals. Enable volume climax detection to identify capitulation moments. Use RSI(6) for early reversal signals, confirmed by RSI(14) and RSI(24).
Forecasting and Planning: Enable regression forecasting with polynomial or exponential smoothing methods. Use forecast horizon of 10-20 bars for swing trading, 5-10 bars for day trading. Confidence bands help assess forecast reliability.
Multi-Timeframe Analysis: Enable higher timeframe RSI to see context from larger timeframes. For example, use daily RSI on hourly charts to understand the larger trend context. This helps avoid counter-trend trades.
Scalping: Select the "Scalping" preset for instant optimal configuration. This preset uses RSI periods (4, 7, 9) with minimal smoothing, disables noise reduction, and disables momentum confirmation for faster signals. Alternatively, manually configure: Use RSI(6) with minimal smoothing (or Zero-Lag) for ultra-fast signals. Disable most filters except volume confirmation. Use RSI period crossovers (RSI(6) × RSI(14)) for early momentum shifts. Set volume threshold to 1.0-1.2 for less restrictive filtering.
Position Trading: Select the "Position Trading" preset for instant optimal configuration. This preset uses extended RSI periods (24, 21, 28) with heavier smoothing, optimized for longer-term trades. Alternatively, manually configure: Use RSI(24) with all filters enabled (Trend, ADX, RSI(50), Volume Dry-Up avoidance). Multi-RSI Synergy in "ALL" mode provides highest-quality signals.
Practical Tips and Best Practices
Getting Started: The fastest way to get started is to select a configuration preset that matches your trading style. Simply choose "Scalping", "Day Trading", "Swing Trading", or "Position Trading" from the "Configuration Preset" dropdown to instantly configure all settings optimally. For advanced users, use "Custom" mode for full manual control. The default configuration (Custom mode) is balanced and works well across different markets. After observing behavior, customize settings to match your trading style.
Reducing Repainting: All signals are based on confirmed bars, minimizing repainting. The script uses confirmed bar data for all calculations to ensure backtesting accuracy.
Signal Quality: Multi-RSI Synergy signals in "ALL" mode provide the highest-quality signals because they require alignment across all three RSI periods. These signals have lower frequency but higher reliability. For more frequent signals, use "2-of-3" mode. The noise reduction system further improves signal quality by requiring multiple confirmations (signal strength, extreme zone, consecutive bars, optional zone persistence and RSI slope). Adjust noise reduction settings to balance signal frequency vs. accuracy.
Filter Combinations: Start with volume confirmation, then add trend filter for trend alignment, then ADX filter for trend strength. Combining all three filters significantly reduces false signals but also reduces signal frequency. Find your balance based on your risk tolerance.
Volume Filtering: Set volume threshold to 0.1 or lower to effectively disable volume filtering if you trade instruments with unreliable volume data or want to test without volume confirmation. Standard confirmation uses 1.2-1.5 threshold.
RSI Period Selection: RSI(6) is most sensitive and best for scalping or early signal detection. RSI(14) provides balanced signals suitable for day trading. RSI(24) is smoother and better for swing trading and trend confirmation. You can disable any RSI period you don't need to reduce visual clutter.
Smoothing Methods: EMA provides balanced smoothing with moderate lag. RMA (Wilder's smoothing) is traditional and works well for RSI. Zero-Lag reduces lag but may increase noise. WMA gives more weight to recent values. Choose based on your preference for responsiveness vs. smoothness.
Forecasting: Linear regression is simplest and works well for trending markets. Polynomial regression captures curves and works better in ranging markets. Exponential smoothing adapts to trends. Moving average method is most conservative. Use confidence bands to assess forecast reliability.
Divergence: Strong divergence (with engulfing confirmation) is more reliable than regular divergence. Hidden divergence indicates continuation rather than reversal, useful for trend-following strategies. Pivot-based divergence provides more accurate detection by using actual pivot points instead of simple lowest/highest comparisons. Adjust lookback periods based on your timeframe: shorter for day trading, longer for swing trading. Pivot divergence period (default 5) controls the sensitivity of pivot detection.
Dynamic Thresholds: Dynamic OB/OS thresholds automatically adapt to volatility. In volatile markets, thresholds widen; in calm markets, they narrow. Adjust the volatility multiplier and base percentage to fine-tune sensitivity. Higher values create wider thresholds in volatile markets.
Alert Management: Enable alert cooldown (default 10 bars, recommended) to prevent alert spam. Each alert type has its own cooldown, so you can set different cooldowns for different signal types. For example, use shorter cooldown for synergy signals (high quality) and longer cooldown for crossovers (more frequent). The cooldown system works independently for each signal type, preventing spam while allowing different signal types to fire when appropriate.
Technical Specifications
- Pine Script Version: v6
- Indicator Type: Non-overlay (displays in separate panel below price chart)
- Repainting Behavior: Minimal - all signals are based on confirmed bars, ensuring accurate backtesting results
- Performance: Optimized with caching for ATR and volume calculations. Forecast arrays are dynamically managed to prevent memory accumulation.
- Compatibility: Works on all timeframes (1 minute to 1 month) and all instruments (stocks, forex, crypto, futures, etc.)
- Edge Case Handling: All calculations include safety checks for division by zero, NA values, and boundary conditions. Reset conditions and alert cooldowns handle edge cases where conditions never occurred or values are NA.
- Reset Logic: Separate reset conditions for buy signals (based on bottom conditions) and sell signals (based on top conditions) ensure logical correctness.
- Input Parameters: 60+ customizable parameters organized into logical groups for easy configuration. Configuration presets available for instant setup (Scalping, Day Trading, Swing Trading, Position Trading, Custom).
- Noise Reduction: Comprehensive noise reduction system with multiple filters (signal strength, extreme zone, consecutive bars, zone persistence, RSI slope) to reduce false signals.
- Pivot-Based Divergence: Enhanced divergence detection using actual pivot points for improved accuracy.
- Momentum Confirmation: RSI momentum filter ensures signals only fire when RSI is accelerating in the signal direction.
- Multi-Timeframe Confirmation: Optional higher timeframe RSI alignment for trend confirmation.
- Enhanced Pivot Trendlines: Trendline drawing with strength requirements, confirmation, and trend break detection.
Technical Notes
- All RSI values are clamped to 0-100 range to ensure valid oscillator values
- ATR and Volume SMA are cached for performance, updating on confirmed and real-time bars
- Reset conditions handle edge cases: if a condition never occurred, reset returns true (allows first signal)
- Alert cooldown handles na values: if no previous alert, cooldown allows the alert
- Forecast arrays are dynamically sized based on horizon, with unused lines cleaned up
- Fill logic uses a minimum gap (0.1) to ensure reliable polygon rendering in TradingView
- All calculations include safety checks for division by zero and boundary conditions. Regression functions validate that horizon doesn't exceed array size, and all array access operations include bounds checking to prevent out-of-bounds errors
- The script uses separate reset conditions for buy signals (based on bottom conditions) and sell signals (based on top conditions) for logical correctness
- Background coloring uses a fallback system: dynamic color takes priority, then RSI(6) heatmap, then monotone if both are disabled
- Noise reduction filters are applied after accuracy filters, providing multiple layers of signal quality control
- Pivot trendlines use strength requirements to filter weak pivots, reducing noise in trendline drawing. Historical trendlines are stored in arrays and automatically limited to prevent memory accumulation when "Keep Historical Trendlines" is enabled
- Volume climax and dry-up markers are positioned at the top of the pane for better visibility
- All calculations are optimized with conditional execution - features only calculate when enabled (performance optimization)
- Input Validation: Automatic cross-input validation ensures smoothing lengths are always less than RSI period lengths, preventing configuration errors
- Configuration Presets: Four optimized preset configurations (Scalping, Day Trading, Swing Trading, Position Trading) for instant setup, plus Custom mode for full manual control
- Constants Management: Magic numbers extracted to documented constants for improved maintainability and easier tuning (pivot tolerance, divergence thresholds, fill gap, etc.)
- TradingView Function Consistency: All TradingView functions (ta.crossover, ta.crossunder, ta.atr, ta.lowest, ta.highest, ta.lowestbars, ta.highestbars, etc.) and custom functions that depend on historical results (f_consecutiveBarConfirmation, f_rsiSlopeConfirmation, f_rsiZonePersistence, f_applyAllFilters, f_rsiMomentum, f_forecast, f_confirmPivotLow, f_confirmPivotHigh) are called on every bar for consistency, as recommended by TradingView. Results are then used conditionally when needed. This ensures consistent calculations and prevents calculation inconsistencies.

Dynamic Support and Resistance ### Indicator: Dynamic Support and Resistance
#### Overview:
The *Dynamic Support and Resistance* indicator is a powerful tool designed to help traders identify key price levels on a chart. It dynamically calculates support and resistance levels based on pivot points and the Average True Range (ATR). The indicator also highlights broken support and resistance zones, providing visual cues for potential trend reversals or continuations.
---
### Key Features:
1. *Dynamic Support and Resistance Levels*:
- The indicator identifies support and resistance levels using pivot highs and lows within a user-defined range.
- These levels are adjusted using the ATR to account for market volatility, making them more responsive to changing market conditions.
2. *Support and Resistance Zones*:
- The indicator draws boxes around the support and resistance levels, with customizable colors and widths.
- The width of the zones is determined by the ATR and a user-defined multiplier, allowing traders to adjust the sensitivity of the zones.
3. *Broken Zones*:
- When price breaks through a support or resistance zone, the zone is highlighted with a distinct color to indicate a potential shift in market sentiment.
- Traders can limit the number of broken zones displayed on the chart to avoid clutter.
4. *Customizable Inputs*:
- *Range Candle Count*: Defines the number of candles analyzed to determine pivot points. Increasing this value will result in fewer but more significant levels, while decreasing it will produce more levels that are sensitive to shorter-term price movements.
- *ATR Period*: Controls the sensitivity of the ATR calculation. A shorter period makes the ATR more responsive to recent price changes, while a longer period smooths it out.
- *Box Width Multiplier*: Adjusts the width of the support and resistance zones. A higher multiplier creates wider zones, which may be useful in more volatile markets.
- *Max Broken Zones*: Limits the number of broken zones displayed on the chart. This helps keep the chart clean and focused on the most recent breaks.
---
### How It Works:
1. *Pivot Points*:
- The indicator identifies pivot highs and lows within the specified range. These pivots serve as the basis for calculating support and resistance levels.
2. *ATR Adjustment*:
- The ATR is used to adjust the support and resistance levels, making them more dynamic and responsive to market volatility.
3. *Zone Creation*:
- Support and resistance zones are drawn as boxes around the pivot levels. The width of these zones is determined by the ATR and the box width multiplier.
4. *Zone Breaks*:
- When price breaks through a zone, the zone is highlighted with a distinct color, and the broken zone is added to an array. If the number of broken zones exceeds the user-defined limit, the oldest broken zone is removed from the chart.
---
### How to Use:
1. *Trend Identification*:
- Use the support and resistance levels to identify key price levels where the market may reverse or consolidate.
- Broken zones can signal potential trend reversals or continuations.
2. *Entry and Exit Points*:
- Traders can use the support and resistance zones as potential entry or exit points. For example, buying near support or selling near resistance.
- Broken zones can be used as confirmation for breakout strategies.
3. *Risk Management*:
- The width of the zones can help traders set stop-loss levels. For example, placing a stop-loss just outside a support or resistance zone.
4. *Customization*:
- Adjust the input parameters to suit your trading style and the specific market conditions. For example, increase the range candle count for longer-term analysis or decrease it for shorter-term trading.
---
### Who Should Use This Indicator?
- *Swing Traders*: Can use the indicator to identify key levels for potential reversals or breakouts.
- *Day Traders*: Can benefit from the dynamic levels and zones, especially in volatile markets.
- *Position Traders*: Can use the indicator to identify long-term support and resistance levels.
- *Breakout Traders*: Can use the broken zones to confirm breakouts and plan their trades accordingly.
---
### Input Parameters and Their Effects:
1. *Range Candle Count*:
- *Increase*: Produces fewer but more significant levels, suitable for longer-term analysis.
- *Decrease*: Produces more levels, sensitive to shorter-term price movements.
2. *ATR Period*:
- *Increase*: Smoothens the ATR, making the levels less sensitive to recent price changes.
- *Decrease*: Makes the ATR more responsive to recent price changes, resulting in more dynamic levels.
3. *Box Width Multiplier*:
- *Increase*: Creates wider zones, suitable for more volatile markets.
- *Decrease*: Creates narrower zones, suitable for less volatile markets.
4. *Max Broken Zones*:
- *Increase*: Displays more broken zones on the chart, providing more historical context.
- *Decrease*: Keeps the chart clean by displaying only the most recent broken zones.
---
### Conclusion:
The *Dynamic Support and Resistance* indicator is a versatile tool that can be adapted to various trading styles and market conditions. By dynamically adjusting to market volatility and highlighting key price levels, it provides traders with valuable insights into potential support and resistance areas. Whether you're a swing trader, day trader, or position trader, this indicator can help you make more informed trading decisions.
---
### Publishing on TradingView:
- *Title*: Dynamic Support and Resistance
- *Description*: A dynamic support and resistance indicator that uses pivot points and ATR to identify key price levels. Includes customizable support/resistance zones and highlights broken zones for breakout trading.
- *Tags*: support, resistance, ATR, pivot points, breakout, trading, indicator
- *Access*: Public or Invite-only, depending on your preference.
This indicator is ready to be published on TradingView, and the detailed description above will help users understand its functionality and how to use it effectively.

Poisson Projection of Price Levels### **Poisson Projection of Price Levels**
**Overview:**
The *Poisson Projection of Price Levels* is a cutting-edge technical indicator designed to identify and visualize potential support and resistance levels based on historical price interactions. By leveraging the Poisson distribution, this tool dynamically adjusts the significance of each price level's past "touches" to project future interactions with varying degrees of probability. This probabilistic approach offers traders a nuanced view of where price levels may hold or react in upcoming bars, enhancing both analysis and trading strategies.
---
**🔍 **Math & Methodology**
1. **Strata Levels:**
- **Definition:** Strata are horizontal lines spaced evenly around the current closing price.
- **Calculation:**
\
where \(i\) ranges from 0 to \(\text{Strata Count} - 1\).
2. **Forecast Iterations:**
- **Structure:** The indicator projects five forecast iterations into the future, each spaced by a Fibonacci sequence of bars: 2, 3, 5, 8, and 13 bars ahead. This spacing is inspired by the Fibonacci sequence, which is prevalent in financial market analysis for identifying key levels.
- **Purpose:** Each iteration represents a distinct forecast point where the price may interact with the strata, allowing for a multi-step projection of potential price levels.
3. **Touch Counting:**
- **Definition:** A "touch" occurs when the closing price of a bar is within half the increment of a stratum level.
- **Process:** For each stratum and each forecast iteration, the indicator counts the number of touches within a specified lookback window (e.g., 80 bars), offset by the forecasted position. This ensures that each iteration's touch count is independent and contextually relevant to its forecast horizon.
- **Adjustment:** Each forecast iteration analyzes a unique segment of the lookback window, offset by its forecasted position to ensure independent probability calculations.
4. **Poisson Probability Calculation:**
- **Formula:**
\
\
- **Interpretation:** \(p(k=1)\) represents the probability of exactly one touch occurring within the lookback window for each stratum and iteration.
- **Application:** This probability is used to determine the transparency of each stratum line, where higher probabilities result in more opaque (less transparent) lines, indicating stronger historical significance.
5. **Transparency Mapping:**
- **Calculation:**
\
- **Purpose:** Maps the Poisson probability to a visual transparency level, enhancing the readability of significant strata levels.
- **Outcome:** Strata with higher probabilities (more historical touches) appear more opaque, while those with lower probabilities appear fainter.
---
**📊 **Comparability to Standard Techniques**
1. **Support and Resistance Levels:**
- **Traditional Approach:** Traders identify support and resistance based on historical price reversals, pivot points, or psychological price levels.
- **Poisson Projection:** Automates and quantifies this process by statistically analyzing the frequency of price interactions with specific levels, providing a probabilistic measure of significance.
2. **Statistical Modeling:**
- **Standard Models:** Techniques like Moving Averages, Bollinger Bands, or Fibonacci Retracements offer dynamic and rule-based levels but lack direct probabilistic interpretation.
- **Poisson Projection:** Introduces a discrete event probability framework, offering a unique blend of statistical rigor and visual clarity that complements traditional indicators.
3. **Event-Based Analysis:**
- **Financial Industry Practices:** Event studies and high-frequency trading models often use Poisson processes to model order arrivals or price jumps.
- **Indicator Application:** While not identical, the use of Poisson probabilities in this indicator draws inspiration from event-based modeling, applying it to the context of price level interactions.
---
**💡 **Strengths & Advantages**
1. **Innovative Visualization:**
- Combines statistical probability with traditional support/resistance visualization, offering a fresh perspective on price level significance.
2. **Dynamic Adaptability:**
- Parameters like strata increment, lookback window, and probability threshold are user-defined, allowing customization across different markets and timeframes.
3. **Independent Probability Calculations:**
- Each forecast iteration calculates its own Poisson probability, ensuring that projections are contextually relevant and independent of other iterations.
4. **Clear Visual Cues:**
- Transparency-based coloring intuitively highlights significant price levels, making it easier for traders to identify key areas of interest at a glance.
---
**⚠️ **Limitations & Considerations**
1. **Poisson Assumptions:**
- Assumes that touches occur independently and at a constant average rate (\(\lambda\)), which may not always align with market realities characterized by trends and volatility clustering.
2. **Computational Intensity:**
- Managing multiple iterations and strata can be resource-intensive, potentially affecting performance on lower-powered devices or with very high lookback windows.
3. **Interpretation Complexity:**
- While transparency offers visual clarity, understanding the underlying probability calculations requires a basic grasp of Poisson statistics, which may be a barrier for some traders.
---
**📢 **How to Use It**
1. **Add to TradingView:**
- Open TradingView and navigate to the Pine Script Editor.
- Paste the script above and click **Add to Chart**.
2. **Configure Inputs:**
- **Strata Increment:** Set the desired price step between strata (e.g., `0.1` for 10 cents).
- **Lookback Window:** Define how many past bars to consider for calculating Poisson probabilities (e.g., `80`).
- **Probability Transparency Threshold (%):** Set the threshold percentage to map probabilities to line transparency (e.g., `25%`).
3. **Understand the Forecast Iterations:**
- The indicator projects five forecast points into the future at bar spacings of 2, 3, 5, 8, and 13 bars ahead.
- Each iteration independently calculates its Poisson probability based on the touch counts within its specific lookback window offset by its forecasted position.
4. **Interpret the Visualization:**
- **Opaque Lines:** Indicate higher Poisson probabilities, suggesting historically significant price levels that are more likely to interact again.
- **Fainter Lines:** Represent lower probabilities, indicating less historically significant levels that may be less likely to interact.
- **Forecast Spacing:** The spacing of 2, 3, 5, 8, and 13 bars ahead aligns with Fibonacci principles, offering a natural progression in forecast horizons.
5. **Apply to Trading Strategies:**
- **Support/Resistance Identification:** Use the opaque lines as potential support and resistance levels for placing trades.
- **Entry and Exit Points:** Anticipate price interactions at forecasted levels to plan strategic entries and exits.
- **Risk Management:** Utilize the transparency mapping to determine where to place stop-loss and take-profit orders based on the probability of price interactions.
6. **Customize as Needed:**
- Adjust the **Strata Increment** to fit different price ranges or volatility levels.
- Modify the **Lookback Window** to capture more or fewer historical touches, adapting to different timeframes or market conditions.
- Tweak the **Probability Transparency Threshold** to control the sensitivity of transparency mapping to Poisson probabilities.
**📈 **Practical Applications**
1. **Identifying Key Levels:**
- Quickly visualize which price levels have historically had significant interactions, aiding in the identification of potential support and resistance zones.
2. **Forecasting Price Reactions:**
- Use the forecast iterations to anticipate where price may interact in the near future, assisting in planning entry and exit points.
3. **Risk Management:**
- Determine areas of high probability for price reversals or consolidations, enabling better placement of stop-loss and take-profit orders.
4. **Market Analysis:**
- Assess the strength of market levels over different forecast horizons, providing a multi-layered understanding of market structure.
---
**🔗 **Conclusion**
The *Poisson Projection of Price Levels* bridges the gap between statistical modeling and traditional technical analysis, offering traders a sophisticated tool to quantify and visualize the significance of price levels. By integrating Poisson probabilities with dynamic transparency mapping, this indicator provides a unique and insightful perspective on potential support and resistance zones, enhancing both analysis and trading strategies.
---
**📞 **Contact:**
For support or inquiries, please contact me on TradingView!
---
**📢 **Join the Conversation!**
Have questions, feedback, or suggestions for further enhancements? Feel free to comment below or reach out directly. Your input helps refine and evolve this tool to better serve the trading community.
---
**Happy Trading!** 🚀

Chaikin DivergenceOverview
The Chaikin Divergence is a powerful technical indicator designed to enhance the traditional Chaikin Oscillator by incorporating divergence detection between the oscillator and price action. This advanced tool not only plots the Chaikin Oscillator but also identifies and highlights bullish and bearish divergences, providing traders with valuable insights into potential trend reversals and momentum shifts.
Key Features
Chaikin Oscillator Plotting: Visual representation of the Chaikin Oscillator, aiding in the analysis of market momentum based on volume and price.
Divergence Detection:
Bullish Divergence: Indicates potential upward reversals when price forms lower lows while the oscillator forms higher lows.
Bearish Divergence: Signals possible downward reversals when price creates higher highs while the oscillator forms lower highs.
Customizable Settings:
Fast Length & Slow Length: Adjust the periods for the Exponential Moving Averages (EMA) used in the oscillator calculation.
Pivot Detection Parameters: Define the sensitivity of pivot high and pivot low detection with adjustable left and right bars.
Bars Lookback for Divergence: Set the number of bars to look back for identifying divergences.
Color Customization: Choose distinct colors for bullish and bearish divergence labels to match your trading preferences.
Visual Indicators:
Divergence Labels: Clear and distinct labels (arrows or dots) on the chart indicating the type and location of divergences.
Zero Line: A dashed zero line to reference the oscillator’s crossing points.
Chaikin Oscillator Calculation:
The indicator calculates the Chaikin Oscillator by subtracting the slow EMA of the Accumulation/Distribution Line (ta.accdist) from the fast EMA.
This oscillates around the zero line, indicating buying and selling pressure.
Pivot Detection:
Utilizes ta.pivothigh and ta.pivotlow functions to identify significant pivot points in price action. These pivot points serve as reference points for divergence analysis.
Divergence Identification:
Bullish Divergence: Detected when a recent pivot low in price is lower than the previous pivot low, while the corresponding oscillator value is higher than the previous oscillator pivot.
Bearish Divergence: Identified when a recent pivot high in price is higher than the previous pivot high, but the oscillator value is lower than the previous oscillator pivot.
Label Plotting:
When a divergence is detected, the indicator plots a label (arrow or dot) on the chart at the pivot point, signaling the type of divergence.
Adding the Indicator:
Open TradingView and navigate to the chart where you want to apply the indicator.
Open the Pine Editor, paste the Chaikin Oscillator with Divergences script, and add it to your chart.
Configuring Settings:
Fast Length & Slow Length: Adjust these to modify the sensitivity of the Chaikin Oscillator. Shorter periods make the oscillator more responsive to price changes.
Left Bars for Pivots & Right Bars for Pivots: Define how many bars to the left and right are considered when identifying pivot points. Increasing these values makes pivot detection less sensitive.
Bars Lookback for Divergence: Set how far back the indicator should search for previous pivot points when identifying divergences. A higher value allows detection over a longer timeframe.
Bullish/Bearish Divergence Colors: Choose colors that stand out against your chart background for easy identification of divergence signals.
Interpreting Signals:
Bullish Divergence Labels: Appear when there's a potential upward reversal, signaling a possible buying opportunity.
Bearish Divergence Labels: Show up when a downward reversal might be imminent, indicating a possible selling opportunity.
Oscillator Crosses Zero: Pay attention to when the oscillator crosses the zero line, as this can also signal changes in momentum.
Combining with Other Indicators:
For enhanced trading strategies, combine divergence signals with other technical indicators or chart patterns to confirm potential trade setups.

Support Resistance UltimateThe "Support Resistance ULTIMATE" indicator is a comprehensive tool for traders on the TradingView platform, designed to identify key support and resistance levels using two primary techniques: pivot points and volume data. This indicator provides flexibility and customization, allowing traders to adapt it to their specific trading strategies.
KEY FEATURES
Pivot-Based Levels:
This feature calculates support and resistance levels using pivot points, which are derived from the high, low, and close prices of previous trading periods. Pivot points are crucial for forecasting potential market turning points.
Users can customize the pivot calculation by selecting the source type (either 'Close' or 'High/Low') and adjusting the lookback periods for both the left and right sides of the pivot calculation. This flexibility allows traders to adapt the indicator to different market conditions and timeframes.
Volume-Based Levels:
This option focuses on identifying support and resistance levels based on volume data, specifically the Point of Control (POC). The POC represents the price level with the highest traded volume during a specific time period, reflecting a consensus value among market participants.
The indicator includes a rolling POC calculation, allowing traders to dynamically assess areas of significant trading interest that may serve as support or resistance zones.
ADVANTAGES
Customization and Flexibility:
Traders can choose between pivot-based and volume-based levels or use both simultaneously, depending on their analysis needs. This dual approach provides a comprehensive view of market dynamics, accommodating various trading styles.
The indicator offers customizable color settings for support and resistance lines, enhancing chart readability and allowing traders to personalize their visual analysis.
Enhanced Market Insights:
By utilizing pivot points, traders can identify potential reversal or consolidation points, aiding in the prediction of market trends and the establishment of strategic entry and exit points.
Volume-based levels provide insights into market sentiment and participation, highlighting areas of strong support or resistance based on trading volume. This can improve risk management and trade execution by identifying high-probability trading zones.
Importance Scoring:
The indicator calculates the importance of each level based on the number of touches and the duration it holds. This scoring system helps traders assess the strength of support and resistance levels, with thicker lines indicating more significant levels.
This indicator is intended for educational and informational purposes only and should not be considered financial advice. Trading involves significant risk, and you should consult with a financial advisor before making any trading decisions. The performance of this indicator is not guaranteed, and past results do not predict future performance. Use at your own risk.

[r380]Bear & Bull Pivot Signal Indicator_(Lite))Bear & Bull Pivot Signal Indicator
Overview:
The Bear & Bull Multi Pivot Signal Indicator is a comprehensive trading tool designed to identify potential market reversal points and trend changes. This indicator combines multiple technical analysis strategies such as RSI, MACD, and pivot points to generate reliable signals. By overlapping these signals, the indicator increases the possibility of accurate trend predictions, providing traders with valuable insights for informed decision-making.
"This indicator is primarily optimized for Bitcoin on a 15-minute timeframe and is recommended for short-term trading. Reliability on other timeframes is not guaranteed."
Key Features:
Bear and Bull Signals: Clearly indicate potential market reversal points using bear and bull emojis.
Support and Resistance Signals: Indicated with sun and snowflake emojis to show critical price levels.
Overheat Cooldown Pivot: Detects market exhaustion points to signal potential reversals.
Settings:
RSI Settings: Adjust the RSI period and thresholds to match your trading strategy. Default values are optimized for short-term trading.
MACD Settings: The MACD settings are pre-configured but can be customized if needed.
Visual Settings: If excessive signals cause visual discomfort, you can selectively enable or disable features in the visual settings.
Signal Descriptions:
🐻 Bear Signal: Indicates a potential high point where the market may reverse downwards. Combines RSI and MACD conditions to provide a reliable overbought signal. When accompanied by high volume, it can indicate a strong resistance level.
🐮 Bull Signal: Indicates a potential low point where the market may reverse upwards. Uses both RSI and MACD conditions to highlight oversold situations. When accompanied by high volume, it can indicate a strong support level.
❄️ Resistance Signal: Shows a resistance level where the price has difficulty moving higher. When the price crosses below this level, it signals a potential downward movement. Combined with high volume, it can signify robust resistance.
☀️ Support Signal: Shows a support level where the price has difficulty moving lower. When the price crosses above this level, it signals a potential upward movement. Combined with high volume, it can signify strong support.
Detailed Explanation:
This indicator is not simply a combination of multiple indicators but is designed to increase the probability of detecting potential trend reversal signals by using multiple signals. If signals only appear when multiple conditions are met, how many trades can we make in a year? Because there is no 100% certainty in any situation, we need to use various signals to construct our strategy and proceed with trading. For example, if only one signal appears, the reliability of the trend reversal signal is somewhat weak, so we can strategize by betting only a portion of the capital. If multiple signals appear simultaneously, we can consider it a highly reliable trend reversal signal and increase the betting amount and stop loss accordingly. The essence of this indicator, in my view, is not to blindly trade based on signals but to use it as an auxiliary tool for strategic decision-making.
RSI (Relative Strength Index), MACD, and Stochastic RSI: By using various indicators to confirm trend reversal signals, bear and bull emojis are included. If the RSI reaches an oversold zone and then drops by a certain amount, while the MACD turns negative and the Stochastic RSI makes a gold or dead cross, the bear and bull signals are activated.
Pivot Points: Calculated based on the high, low, and close prices over a specific lookback period. These points are used to determine support and resistance levels. Pivot points provide a framework for assessing market sentiment and potential reversal zones. The values calculated this way activate the sun and snowflake signals.
The Overheat Cooldown Pivot: captures moments when the market shows signs of exhaustion, particularly when overbought or oversold conditions are accompanied by a drop in volume. This helps traders anticipate market turning points more effectively. These signals appear as red or green triangles indicating potential reversals. Although similar to the bear and bull signals in detecting market cool-off points, these signals rely on volume and may have slightly lower reliability.
Practical Application:
By using this indicator, traders can strategically adjust their bet sizes based on the reliability of the signals. When multiple signals coincide, it indicates a higher probability of a trend reversal, allowing for larger position sizes. Conversely, when signals occur independently, it suggests a lower probability, warranting smaller position sizes. This approach enables traders to manage their risk effectively and capitalize on high-probability trading opportunities without excessively reducing trading frequency.
Trading Method:
The basic setup is for Bitcoin on a 15-minute timeframe, and short-term trading is recommended by the creator. Upon signal activation, if only one signal appears, verify the volume and support/resistance lines, calculate the risk-reward ratio, and enter a position with a low betting ratio. If three signals activate simultaneously, enter a position with a higher betting ratio.
Reliability Order:
🐻🐮 > ❄️☀️ > 🔻🔺 (replacing green triangle emojis)
This indicator provides a powerful method for detecting multiple potential market reversals and trend continuations.
Note: Have realistic expectations and understand the limitations of technical analysis tools. This indicator is a tool to assist in your trading decisions and not a guaranteed prediction of market movements.
Warning! Do not trade solely based on this indicator.
Additionally, if you find the settings lacking, feel free to adjust them yourself! Thank you!
Korean Version
곰돌이와 송아지 멀티 피봇 시그널 인디케이터
개요:
곰돌이와 송아지 멀티 피봇 시그널 인디케이터는 잠재적 시장 반전 지점과 추세 변화를 식별하기 위해 설계된 종합 거래 도구입니다. 이 인디케이터는 RSI, MACD, 피봇 포인트 등의 여러 기술 분석 전략을 결합하여 신뢰할 수 있는 신호를 생성합니다. 이러한 신호들을 중첩함으로써 정확한 추세 예측의 가능성을 높여, 트레이더가 정보를 기반으로 결정을 내리는 데 유용한 통찰력을 제공합니다.
기본적으로 비트코인 15분봉을 기준으로 하며 매매 방법은 단타를 권장합니다. 다른 타임프레임에서의 신뢰는 보장 하지 않습니다.
주요 기능:
곰돌이와 송아지 신호: 시장의 잠재적 반전 지점을 곰돌이와 송아지 이모지로 명확하게 표시합니다.
지지 및 저항 신호: 중요한 가격 수준을 나타내기 위해 태양과 눈송이 이모지로 표시합니다.
오버히트 쿨다운 피봇: 시장 피로 지점을 감지하여 잠재적 반전 신호를 제공합니다.
세팅방법:
RSI 설정: RSI 기간과 임계값을 조정하여 자신의 거래 전략에 맞춥니다. 기본값은 단기 거래에 최적화되어 있습니다.
MACD 설정: MACD 설정은 미리 구성되어 있으며, 필요에 따라 사용자 정의가 가능합니다.
비쥬얼 세팅: 과도한 시그널 때문에 눈이 아프시다면 비쥬얼세팅에서 선택적으로 기능들을 켜거나 끌 수 있으니 참고하세요.
신호 설명:
🐻 곰돌이 신호: 시장이 하락할 가능성이 있는 고점을 나타냅니다. RSI와 MACD 조건을 결합하여 신뢰할 수 있는 과매수 신호를 제공합니다. 높은 거래량과 함께 나타나면 강한 저항 수준을 나타낼 수 있습니다.
🐮 송아지 신호: 시장이 상승할 가능성이 있는 저점을 나타냅니다. RSI와 MACD 조건을 사용하여 과매도 상황을 강조합니다. 높은 거래량과 함께 나타나면 강한 지지 수준을 나타낼 수 있습니다.
❄️ 저항 신호: 가격이 더 이상 상승하기 어려운 저항 수준을 나타냅니다. 가격이 이 수준 아래로 하락하면 잠재적 하락 움직임을 신호합니다. 높은 거래량과 함께 나타나면 강력한 저항을 의미할 수 있습니다.
☀️ 지지 신호: 가격이 더 이상 하락하기 어려운 지지 수준을 나타냅니다. 가격이 이 수준 위로 상승하면 잠재적 상승 움직임을 신호합니다. 높은 거래량과 함께 나타나면 강한 지지를 의미할 수 있습니다.
상세 설명:
이 인디케이터는 여러 인디케이터를 단순히 결합한 것이 아니라, 여러가지 시그널들을 사용해서 잠재적 추세전환 신호 감지 확률을 높이는 것에 목적이 있습니다. 단순히 여러가지 조건들이 중첩되었을때만 신호가 뜬다면 우리는 1년에 몇번이나 매매를 할 수 있을까요. 모든경우에 100% 라는 경우가 없기때문에 우리는 다양한 신호들을 활용하여 전략을 구성하고 매매를 진행 해야합니다. 예를들어 1개의 시그널만 뜬다면 추세전환 신호의 신뢰도가 다소 약하기 때문에 시드의 일부 금액만 배팅 하는 식으로 전략을 구성 할 수도 있고, 만약 여러가지 시그널들이 충접적으로 뜬다면 신뢰도 높은 추세전환의 신호로 인식하여 배팅금액을 높이고 스탑로스를 높게 잡는 방향으로 전략을 구성 할 수 있습니다. 단순히 맹목적으로 시그널이 떳다고 매매하는것이 아닌 보조 신호로써의 기능, 이것이 내가 생각하는 인디케이터의 역할이자 본질 이라고 생각합니다.
RSI (상대 강도 지수)와 MACD, 스토캐스틱 RSI: 여러가지 지표들을 기반으로 추세 반전의 신호를 확인 할 수 있는 곰돌이와 송아지를 넣었습니다. RSI 가 과매도 구간에 도달한 이후일정 수치 이상 하락하는 동시에 MACD가 음수로 변하고 스토캐스틱 RSI가 골드, 데드 크로스가 된다면 곰돌이와 송아지 신호가 활성화 됩니다.
피봇 포인트: 특정 되돌아보기 기간 동안의 최고, 최저, 종가를 기반으로 계산됩니다. 이 포인트는 지지 및 저항 수준을 결정하는 데 사용됩니다. 피봇 포인트는 시장 심리와 잠재적 반전 영역을 평가하는 프레임워크를 제공합니다. 이렇게 계산된 값을 기반으로 눈송이와 해 신호가 활성화 됩니다.
오버히트 쿨다운 피봇: 는 과매수 또는 과매도 상태에서 거래량이 감소할 때 시장 피로 지점을 포착하여 잠재적 반전 지점을 신호합니다. 이러한 피로 지점을 식별함으로써 인디케이터는 트레이더가 시장의 전환점을 보다 효과적으로 예측할 수 있도록 돕습니다. 그렇게 추세 반전의 신호로 녹색 또는 붉은색 삼각형 시그널이 뜹니다. 과열된 시장이 냉각되는 포인트를 찾는점에서는 곰돌이 송아지 신호와 비슷하지만 거래량을 기반으로 하고 있기 때문에 명백히 다른 시그널이며 신뢰도는 약간 낮을 수도 있습니다
실용적 적용:
이 인디케이터를 사용함으로써, 트레이더는 신호의 신뢰도에 따라 베팅 크기를 전략적으로 조정할 수 있습니다. 여러 신호가 동시에 나타날 때, 이는 추세 반전의 가능성이 높음을 나타내며, 더 큰 포지션 크기를 허용합니다. 반대로, 신호가 독립적으로 발생할 때는 낮은 가능성을 나타내므로 작은 포지션 크기가 적합합니다. 이 접근 방식은 트레이더가 효과적으로 리스크를 관리하고 높은 확률의 거래 기회를 활용하면서 거래 빈도를 과도하게 줄이는 것을 방지할 수 있게 합니다.
매매방법:
기본적인 세팅은 비트코인 15분 타임프레임이며 제작자는 단타를 추천합니다. 포지션 진입시 시그널이 1개가 뜬다면 거래량과 지지와 저항라인을 확인하고 손익비를 계산후 낮은 배팅 비율로 포지션에 진입합니다. 만약에 3개의 시그널이 동시에 활성화 된다면 보다 높은 비율로 포지션에 진입합니다.
신뢰도 순서:
]🐻🐮 > ❄️☀️ > 🔻🔺(초록 삼각이모지가 없기때문에 이것으로 대체)
이 지표는 여러 잠재적인 시장 반전 및 추세 지속성을 감지하는 강력한 방법을 제공합니다.
참고: 현실적인 기대를 가지고 기술 분석 도구의 한계를 이해하십시오. 이 지표는 시장 움직임을 보장하는 예측이 아니라 거래 결정을 돕기 위한 도구입니다.
경고! 절대 이 지표만을 가지고 매매하지 마십쇼.
추가적으로 제작자는 지표 세팅에 허접이라 꼬우면 당신이 세팅하십쇼! 감사합니다!
